Common Garden
A plant's phenology—specifically its leaf and flower production—is driven by some mix of increasing temperature and increasing day length as winter transitions to spring. But terrestrial ecology's collective understanding of which of these two environmental factors primarily drives this phenology is limited.
This gap in knowledge is critical in the context of how we understand and remediate climate change. Consider that shifts in the timing of plant phenology are the most documented biological indicator of global warming, and are essential to accurate predictions of carbon sources and sinks, terrestrial ecology, agronomics, and most any other ecosystem-related function or service. Even more, in order for our global climate change models to be robust, they must accurately capture and represent these phenological nuances across plant species and communities. Yet plant phenology stands as a relatively poorly understood phenomenon within terrestrial ecology, as only a handful of species' phenological profiles have been sufficiently modeled.
Enter the Temporal Ecology Lab. My team at Harvard set out to sample, test, and model the spring phenology of all 35 deciduous woody plant species common to the Northeast. For each species, we asked, which is the main driver of its spring budburst: warming spring temperatures or increasing day length?
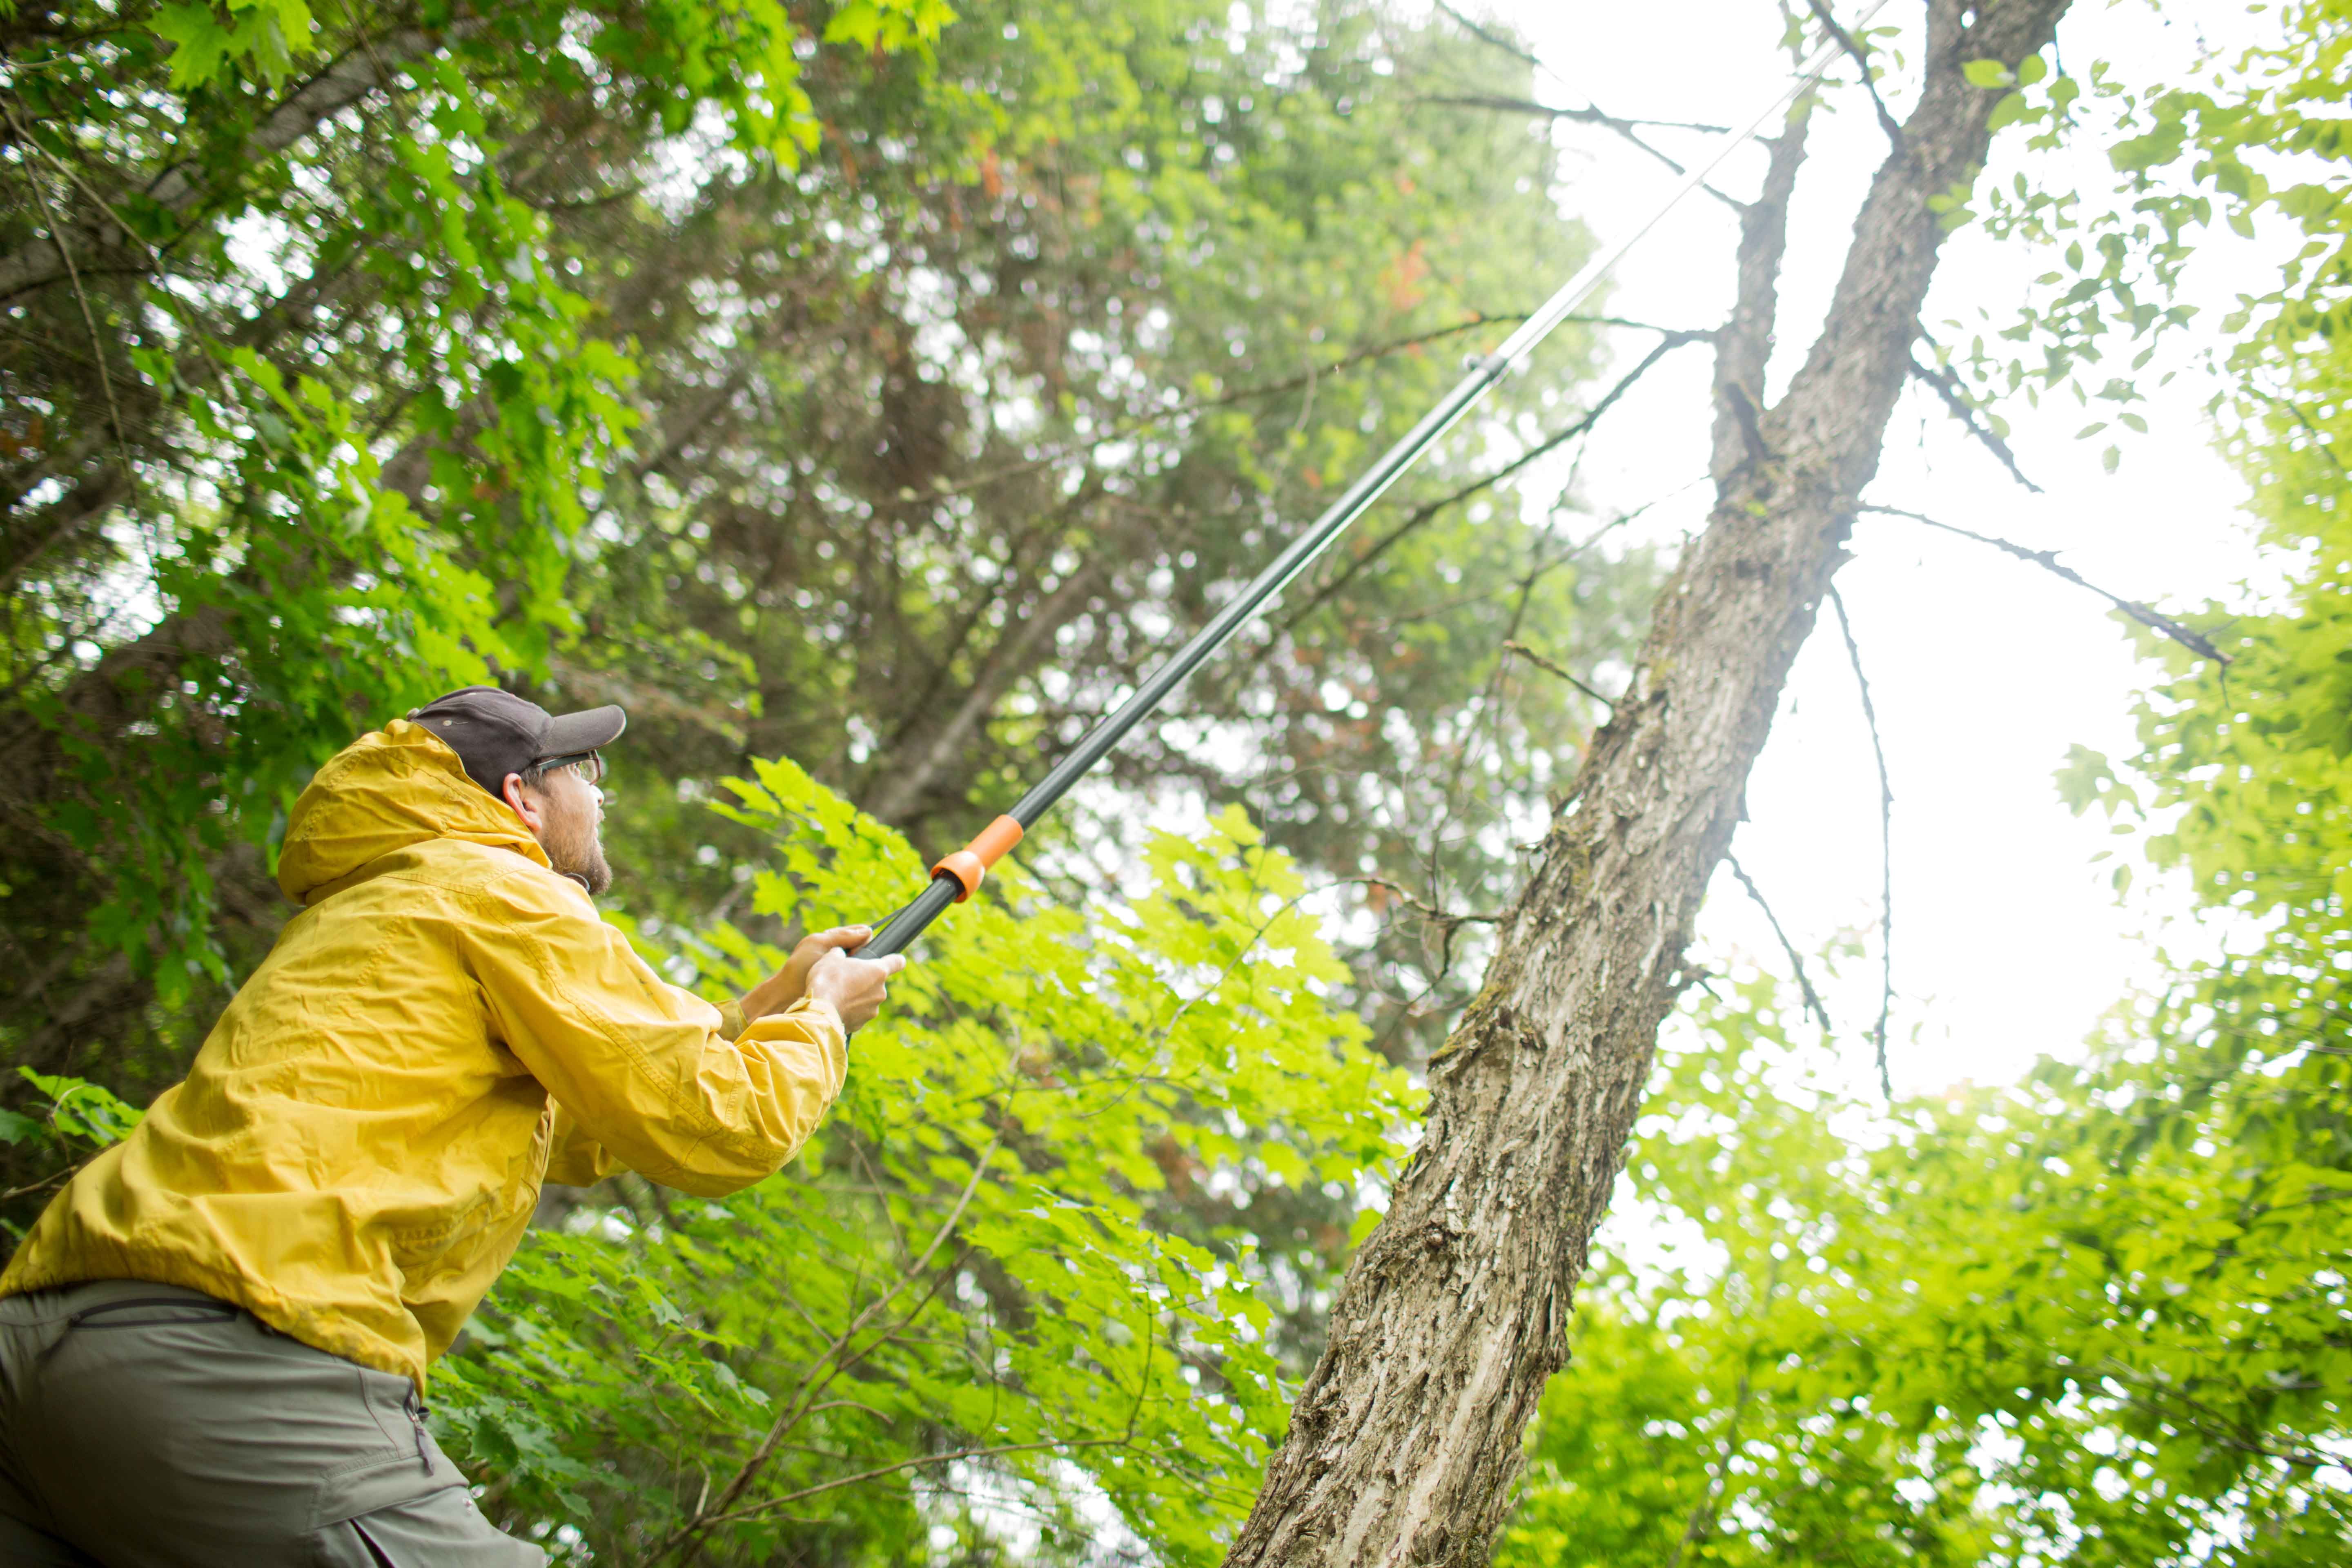
The work began with extensive field work across the Northeast. We chose four sites along a latitudinal gradient, ranging from Boston to Montreal. At each I searched for our list of woody species. Some took minutes to find, others whole weeks. This Vaccinium myrtiloides blueberry bush in particular nearly caused my resignation. But I found it. All told, I identified and sampled roughly 1,500 wild woody plant species to bring back to the lab.
Why four different sites along a latitudinal gradient? Testing from one gene pool isn't an affective way to make claims about a whole species. It's likely that isolated populations of our species have divergently evolved adaptations to their local environments, and so we needed to sample across them. Choosing a latitudinal gradient ensured that our samples represented environments with the most variation in winter and spring temperatures and photoperiods.
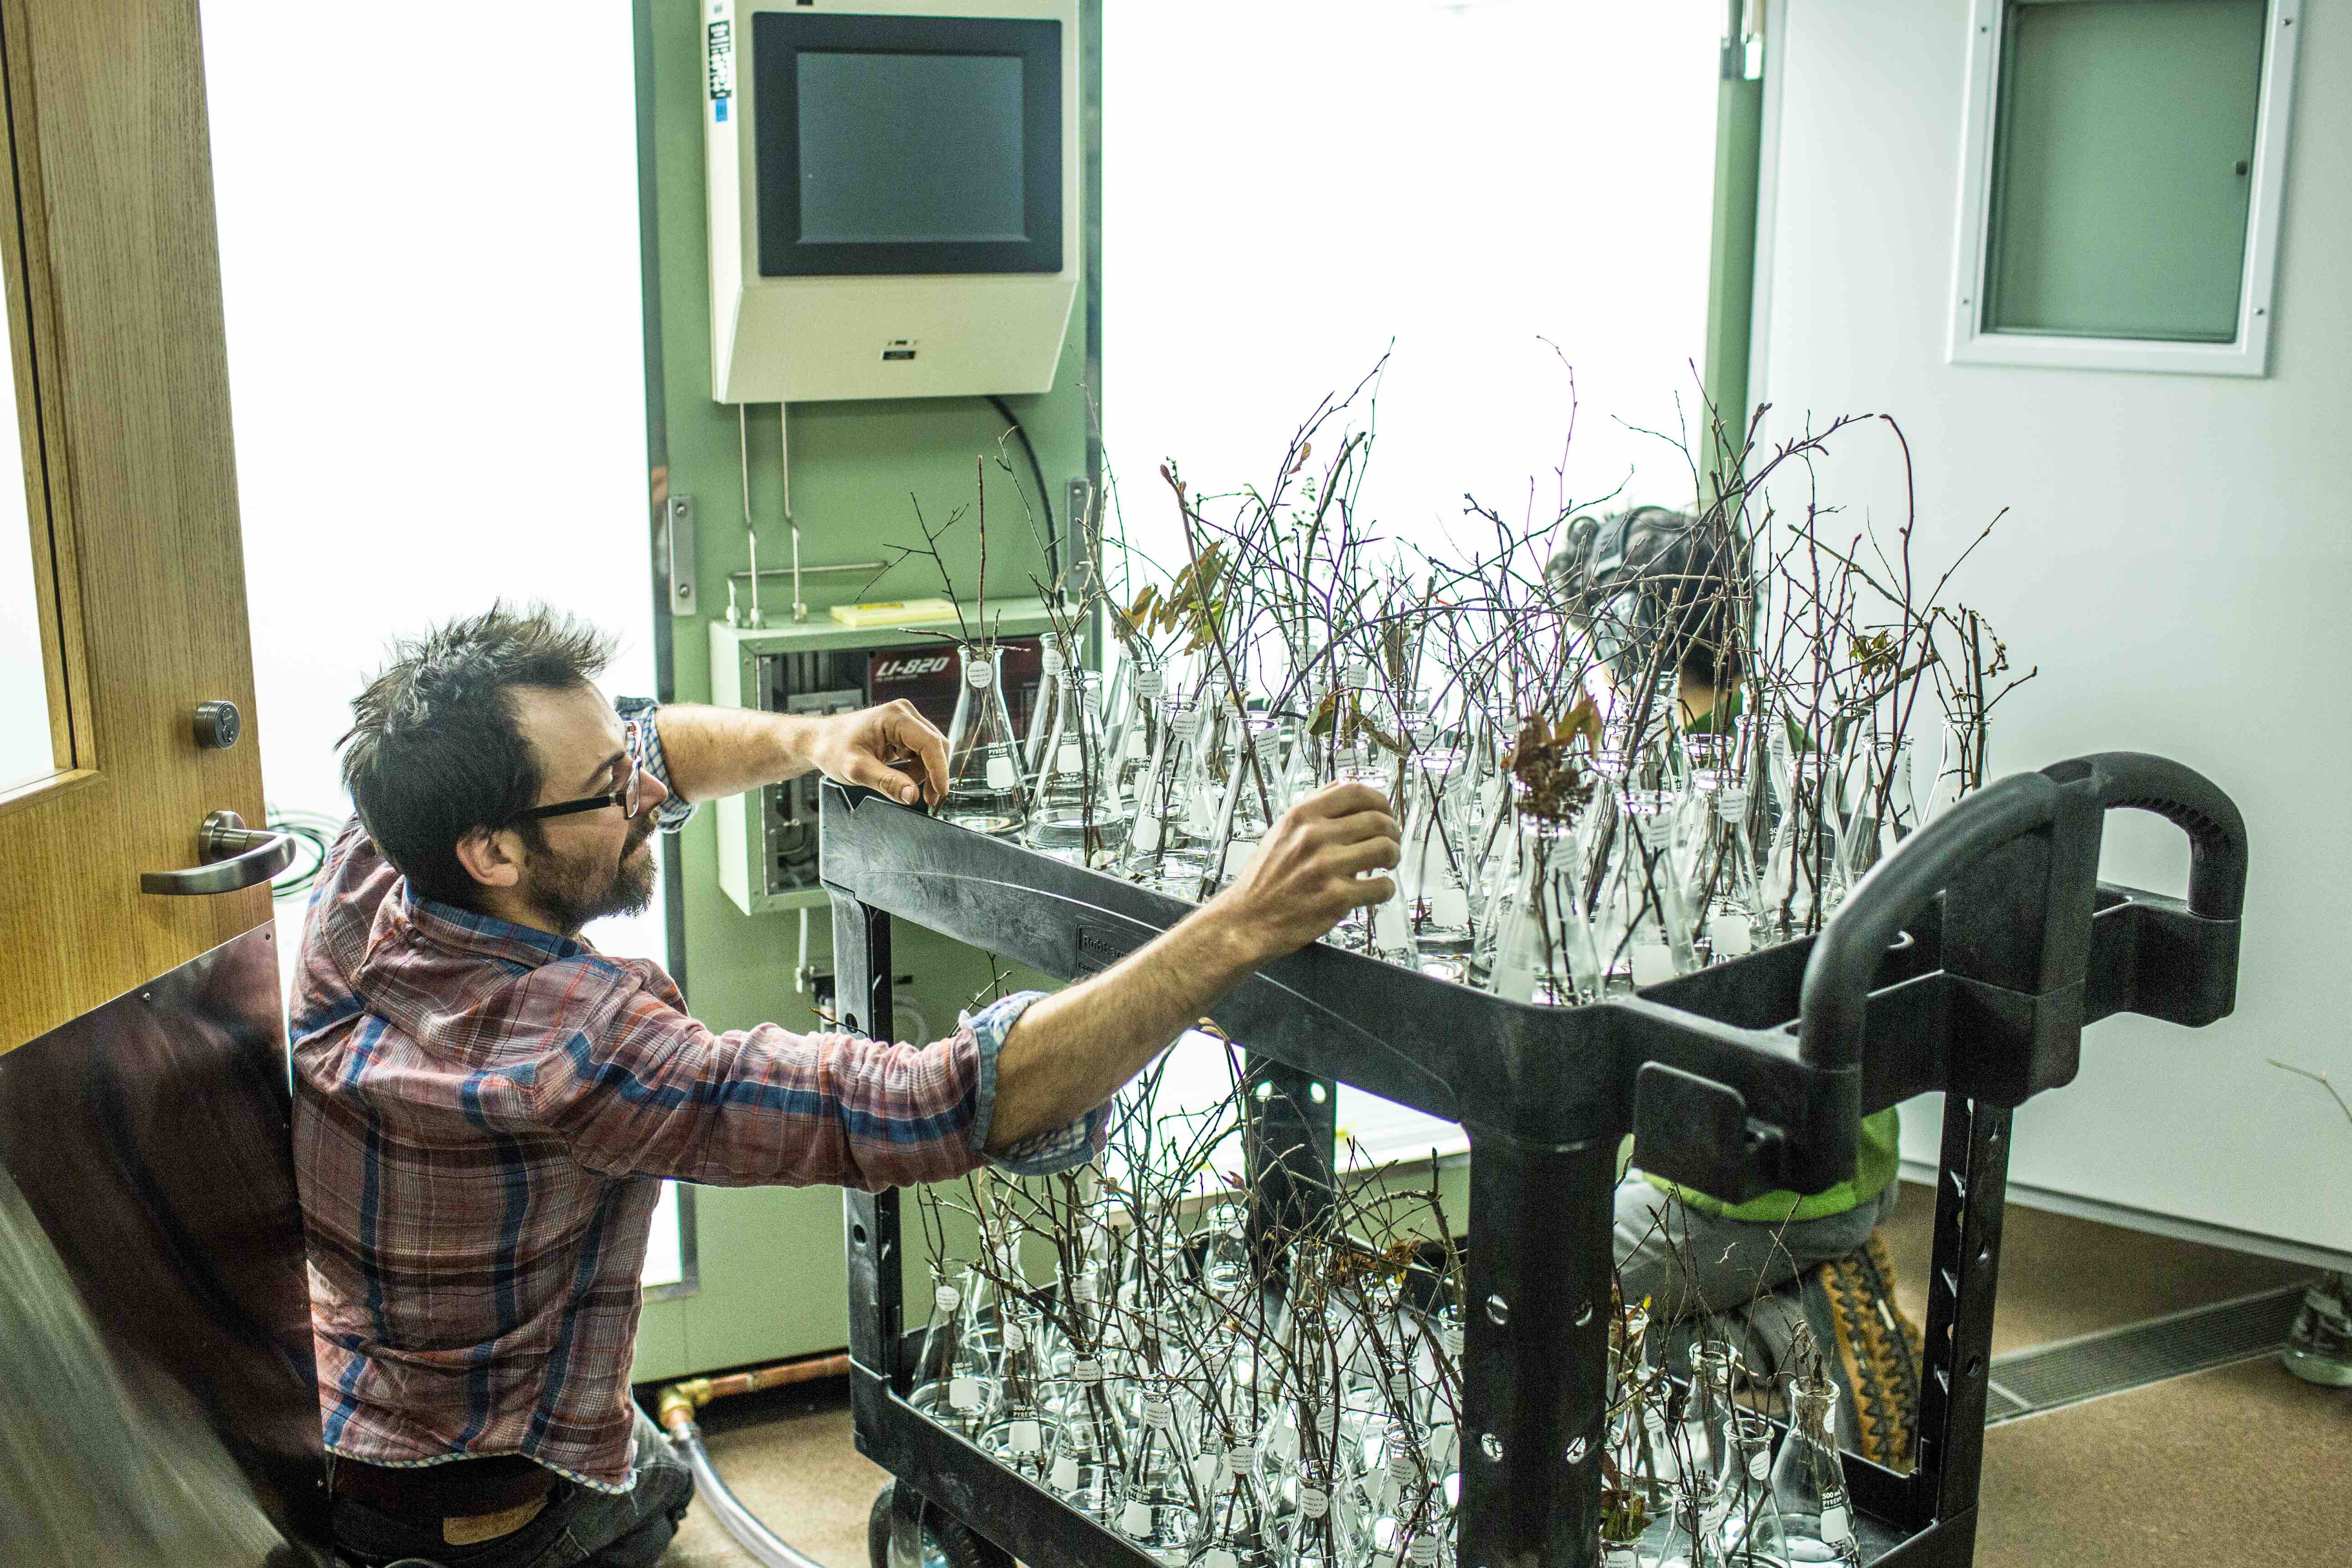
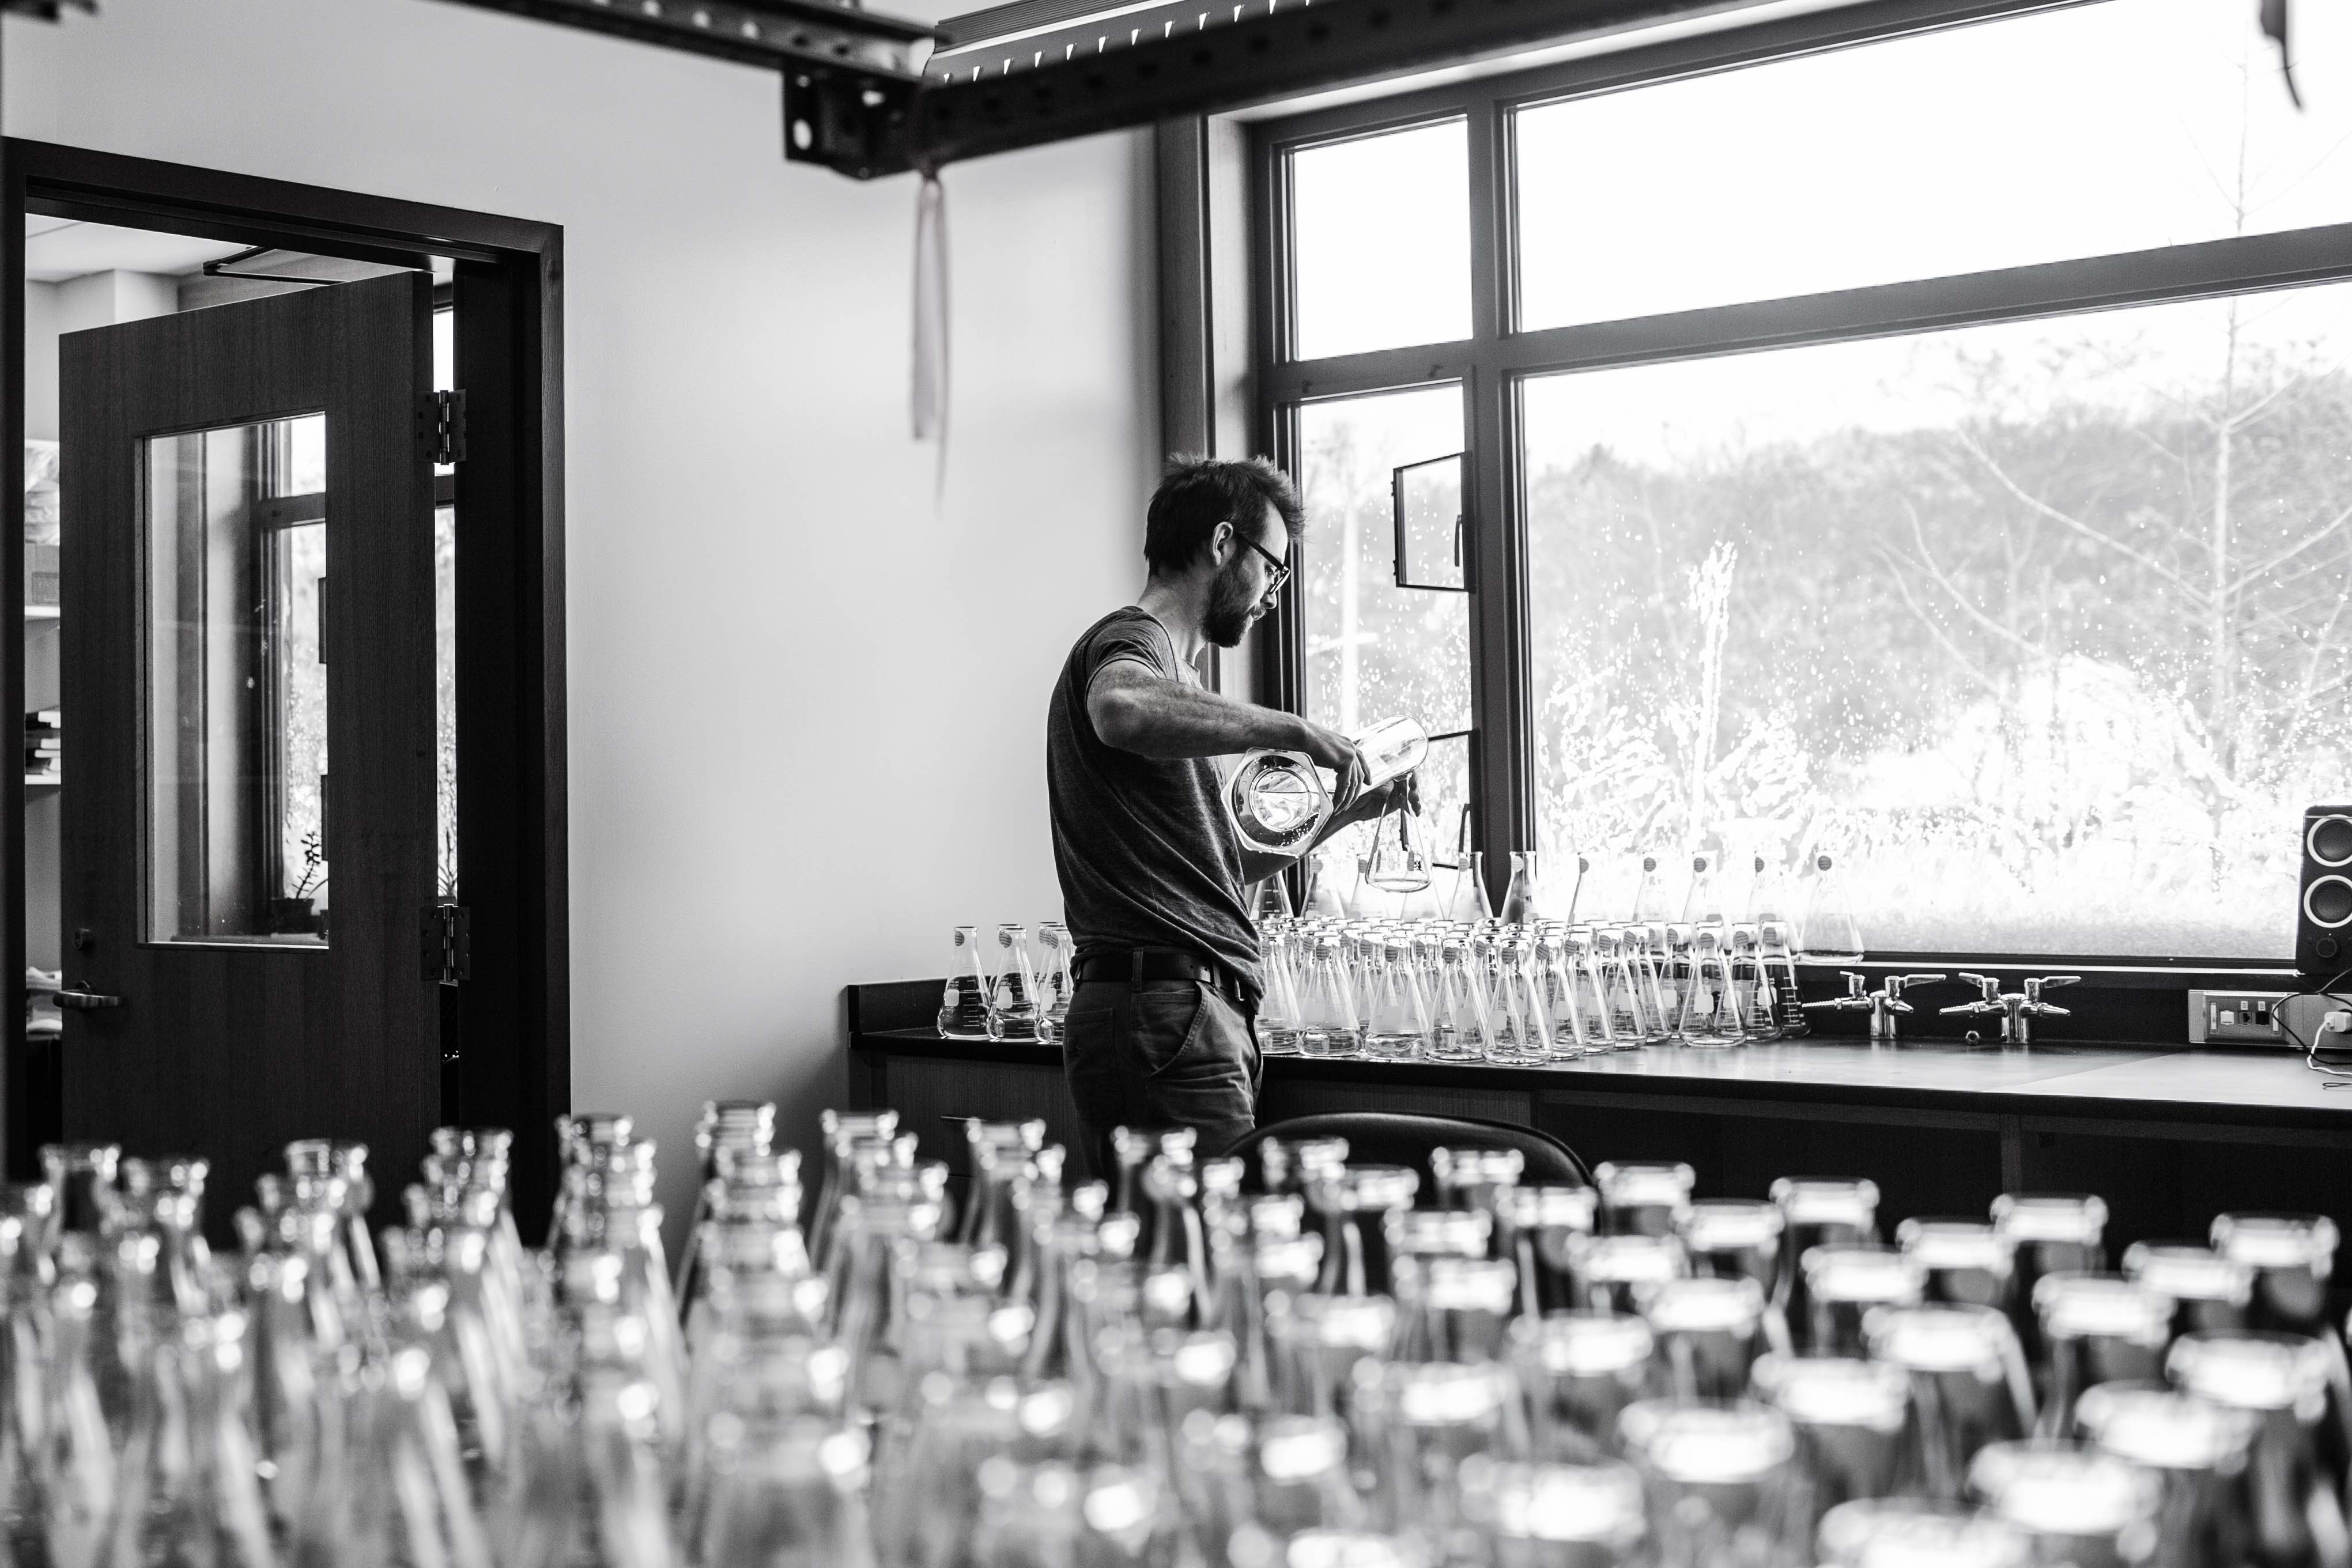
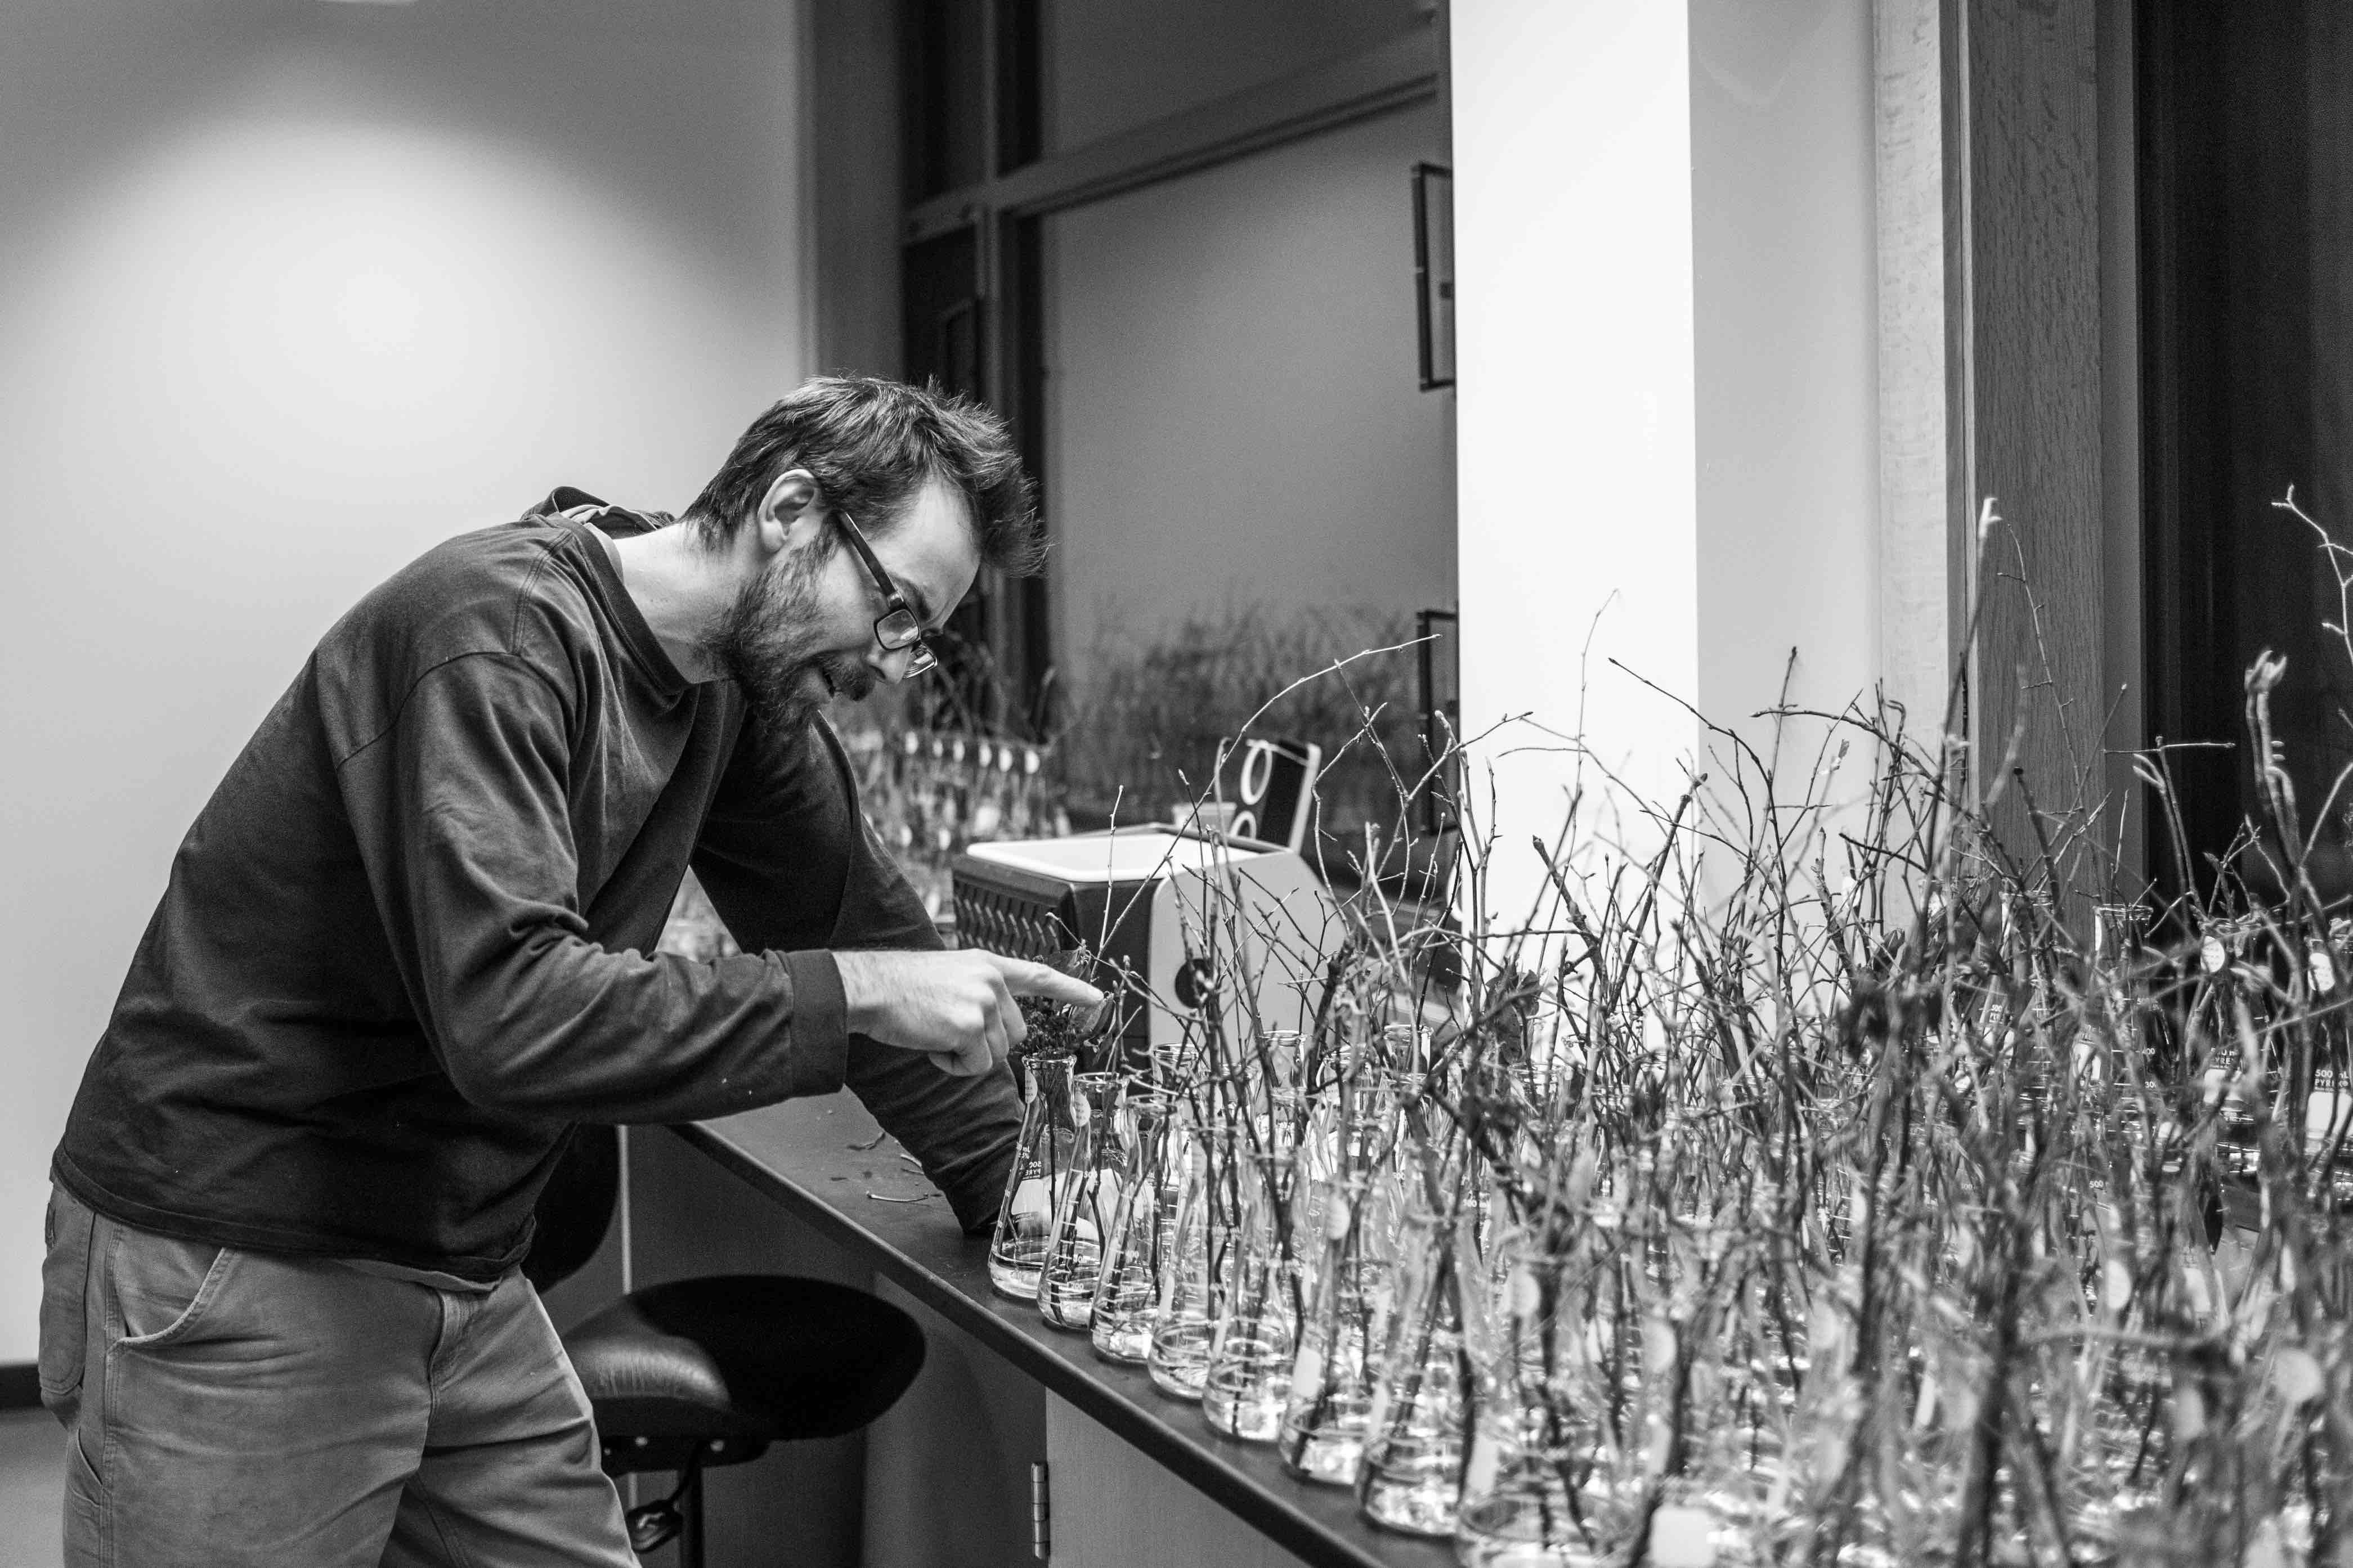
Our test for parcing which environmental factor drove our species' phenology was straightforward. I placed cuttings of our samples in four discrete growth chambers. Each chamber simulated a different spring environment: two with a short photoperiod; two with a long photoperiod; two with a high temperature; two with a low temperature.
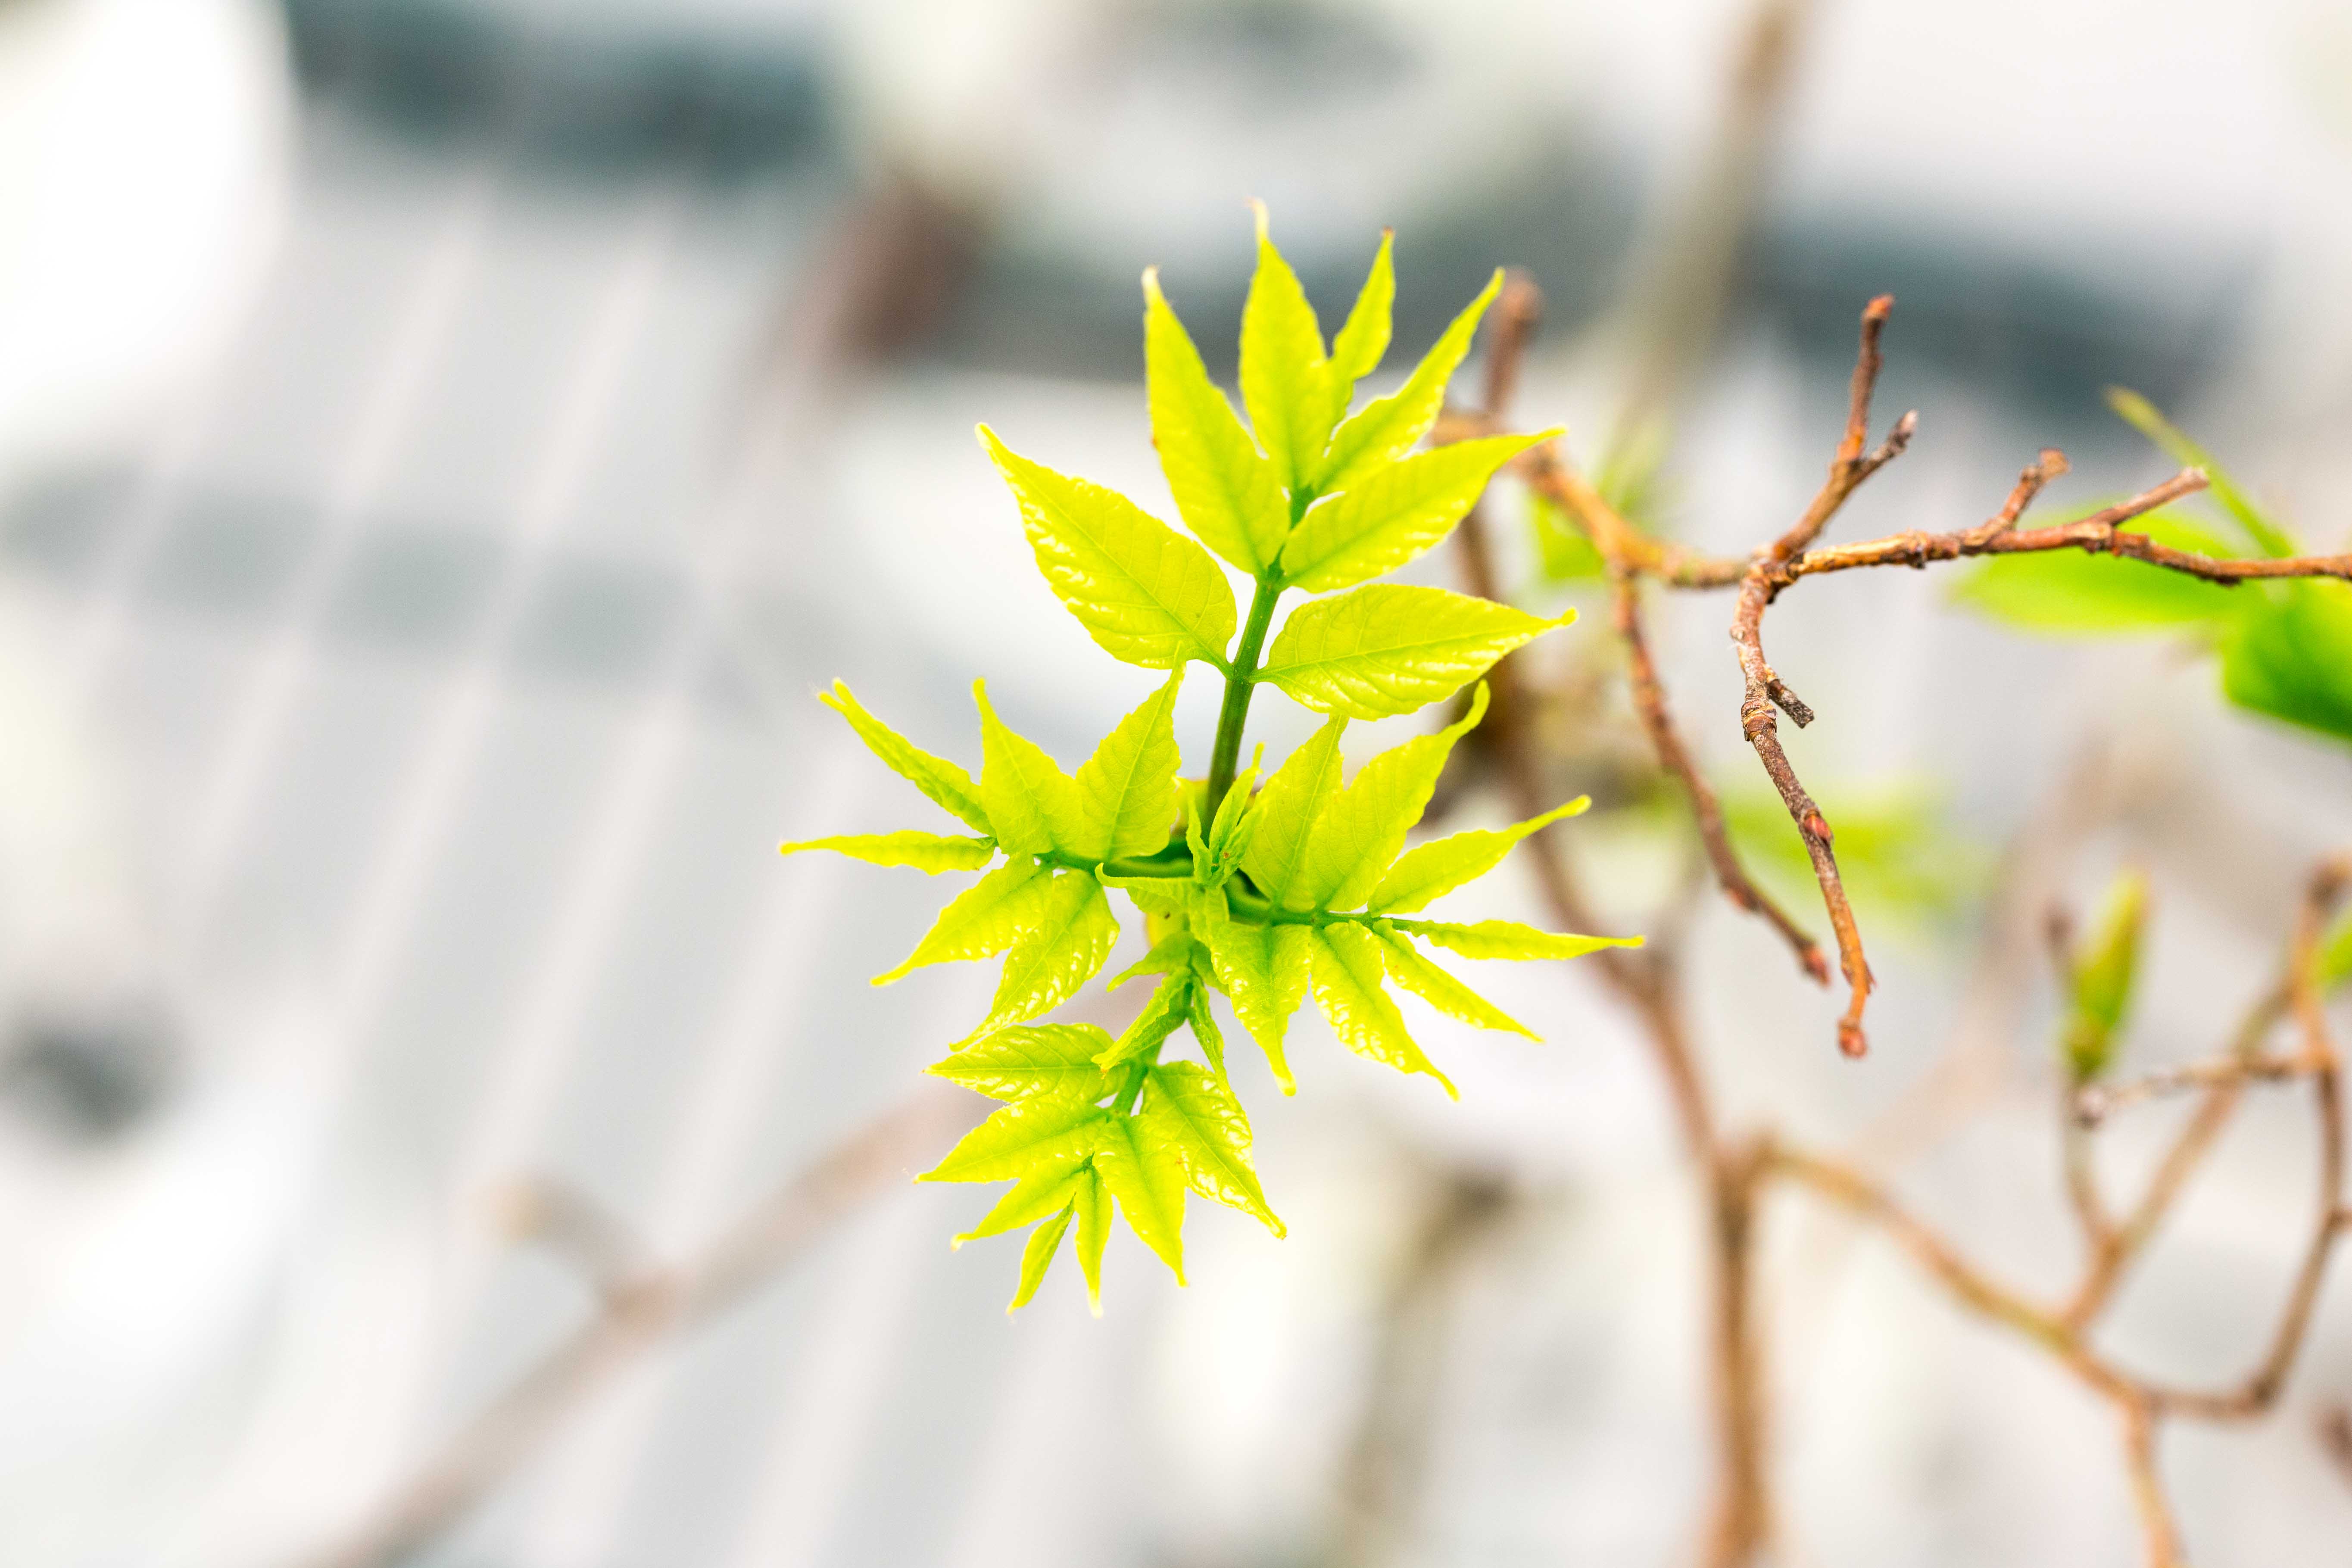
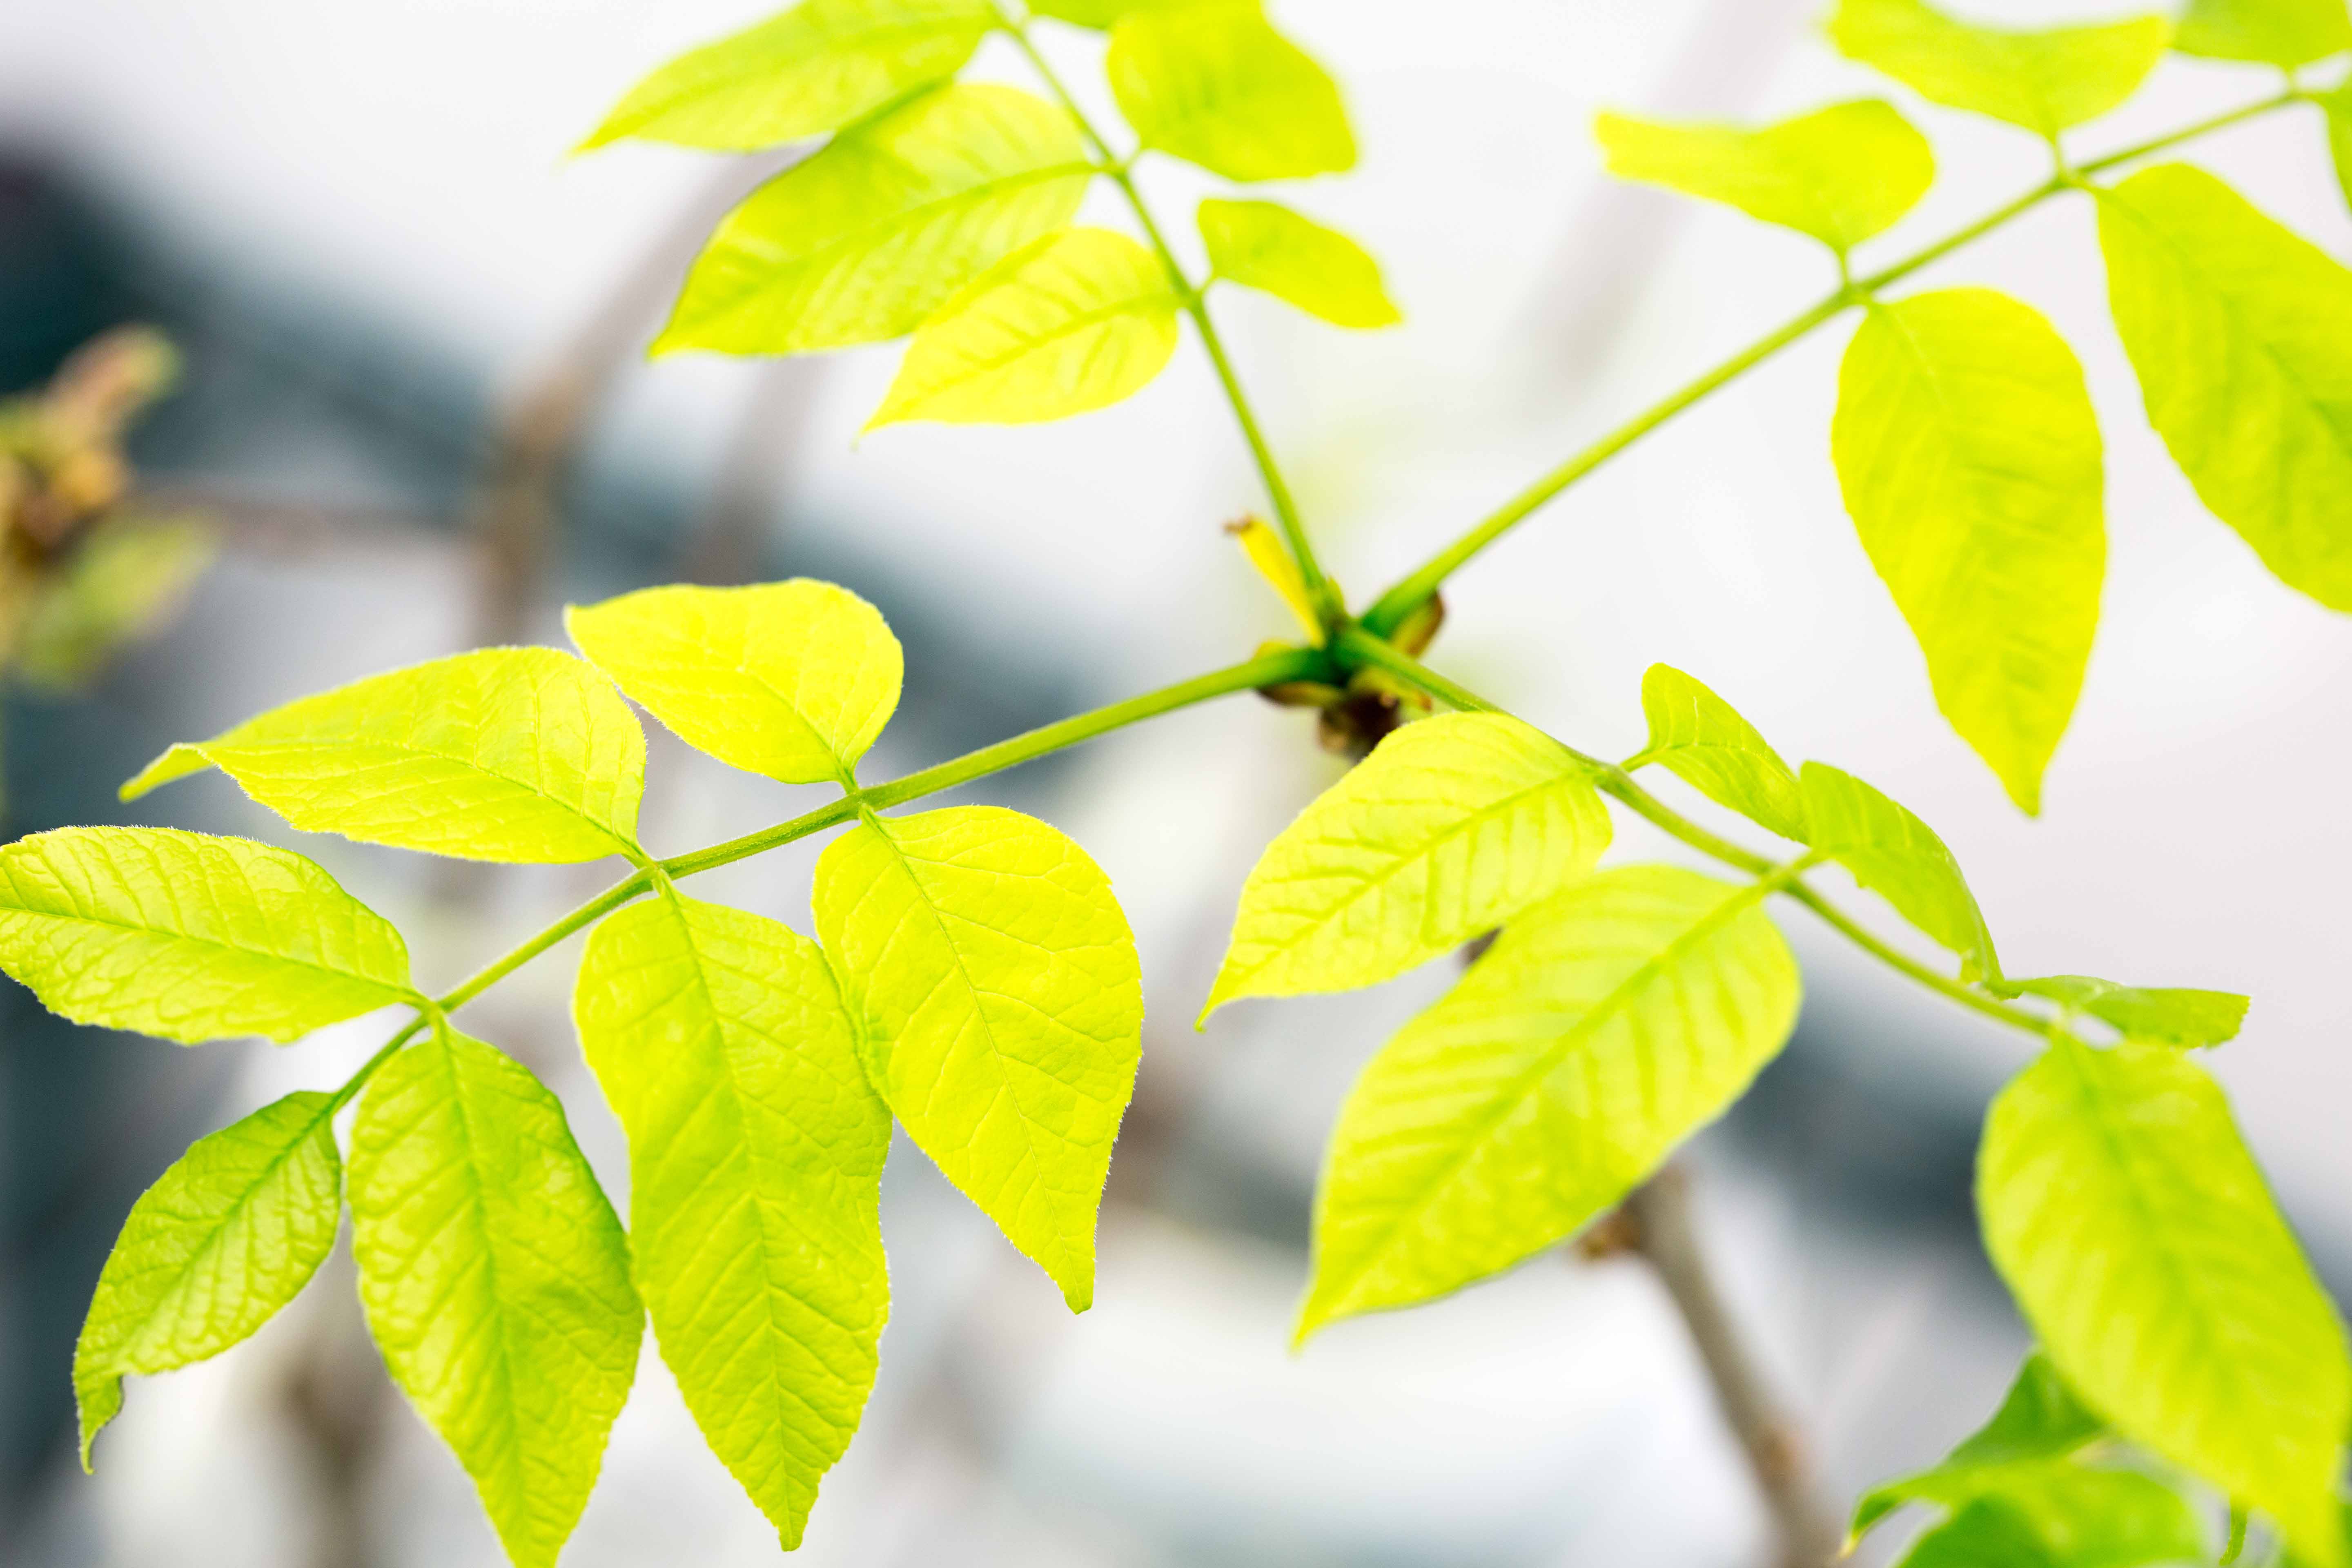
From there I regularly measured the phenological stages of the samples, from dormant bud to full leaf-out, in these simulated spring incubations. Over the course of two years, I collected 40,000 of these datapoints for our study. By the end I felt like Mendel.
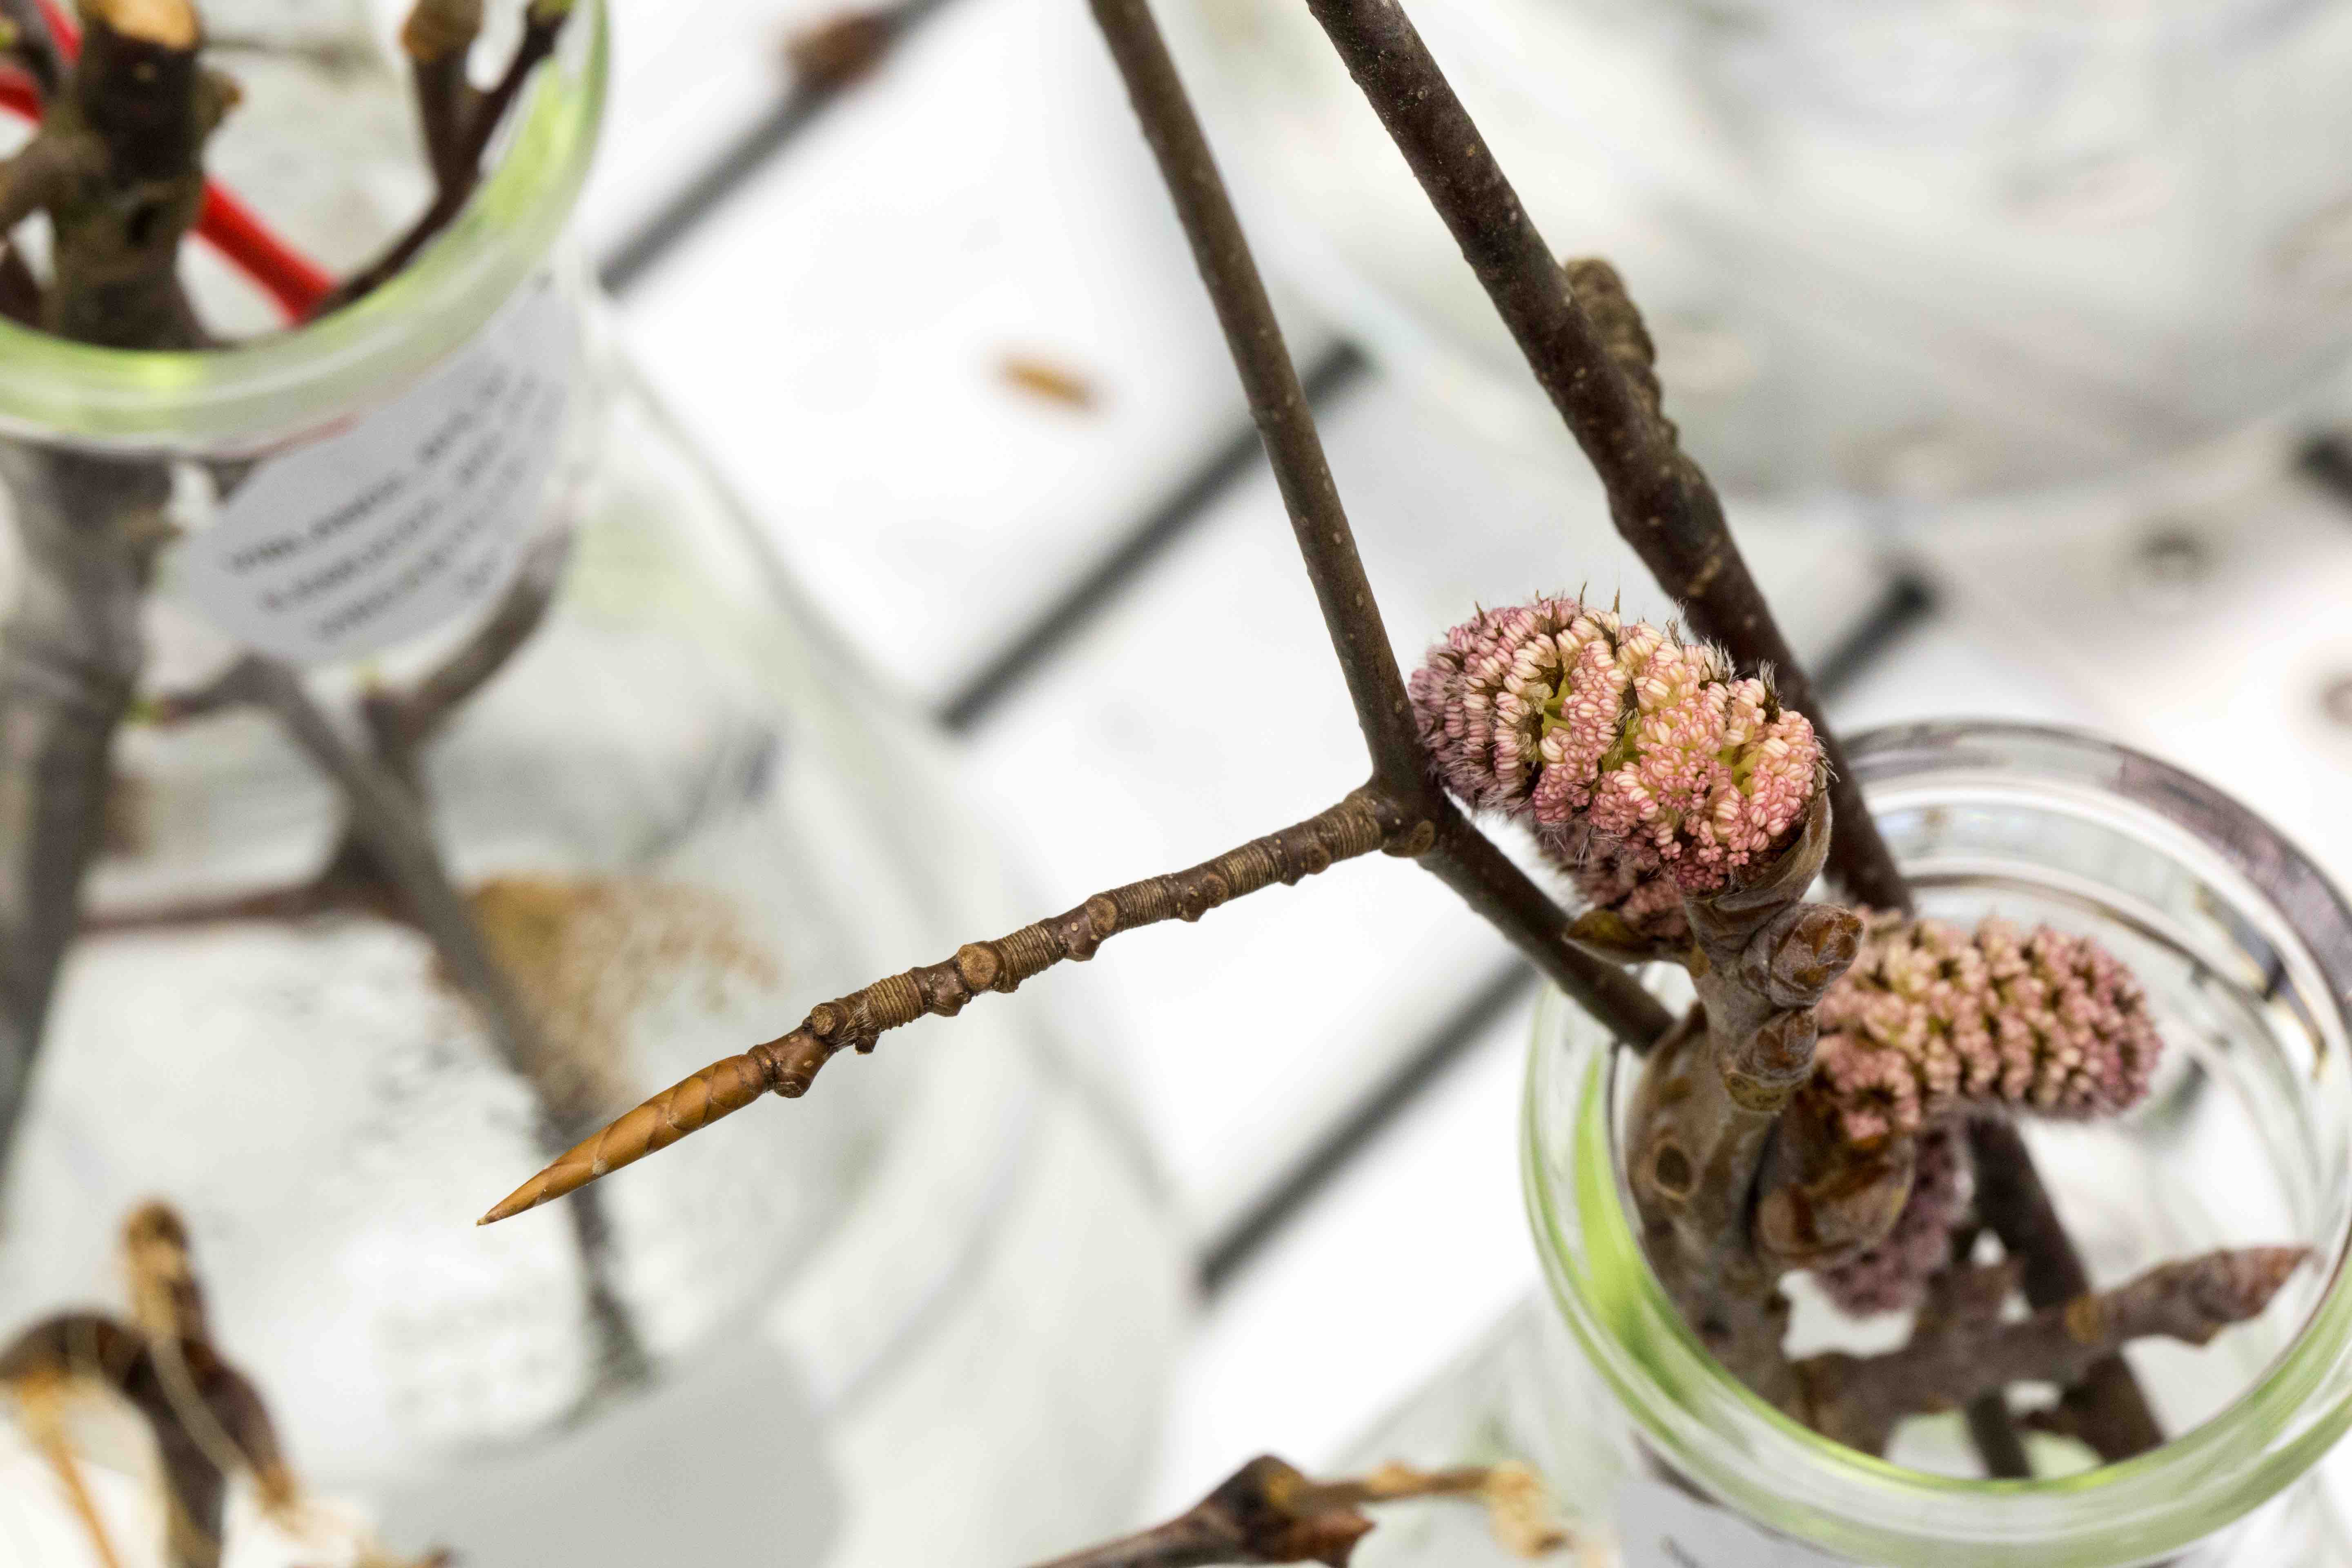
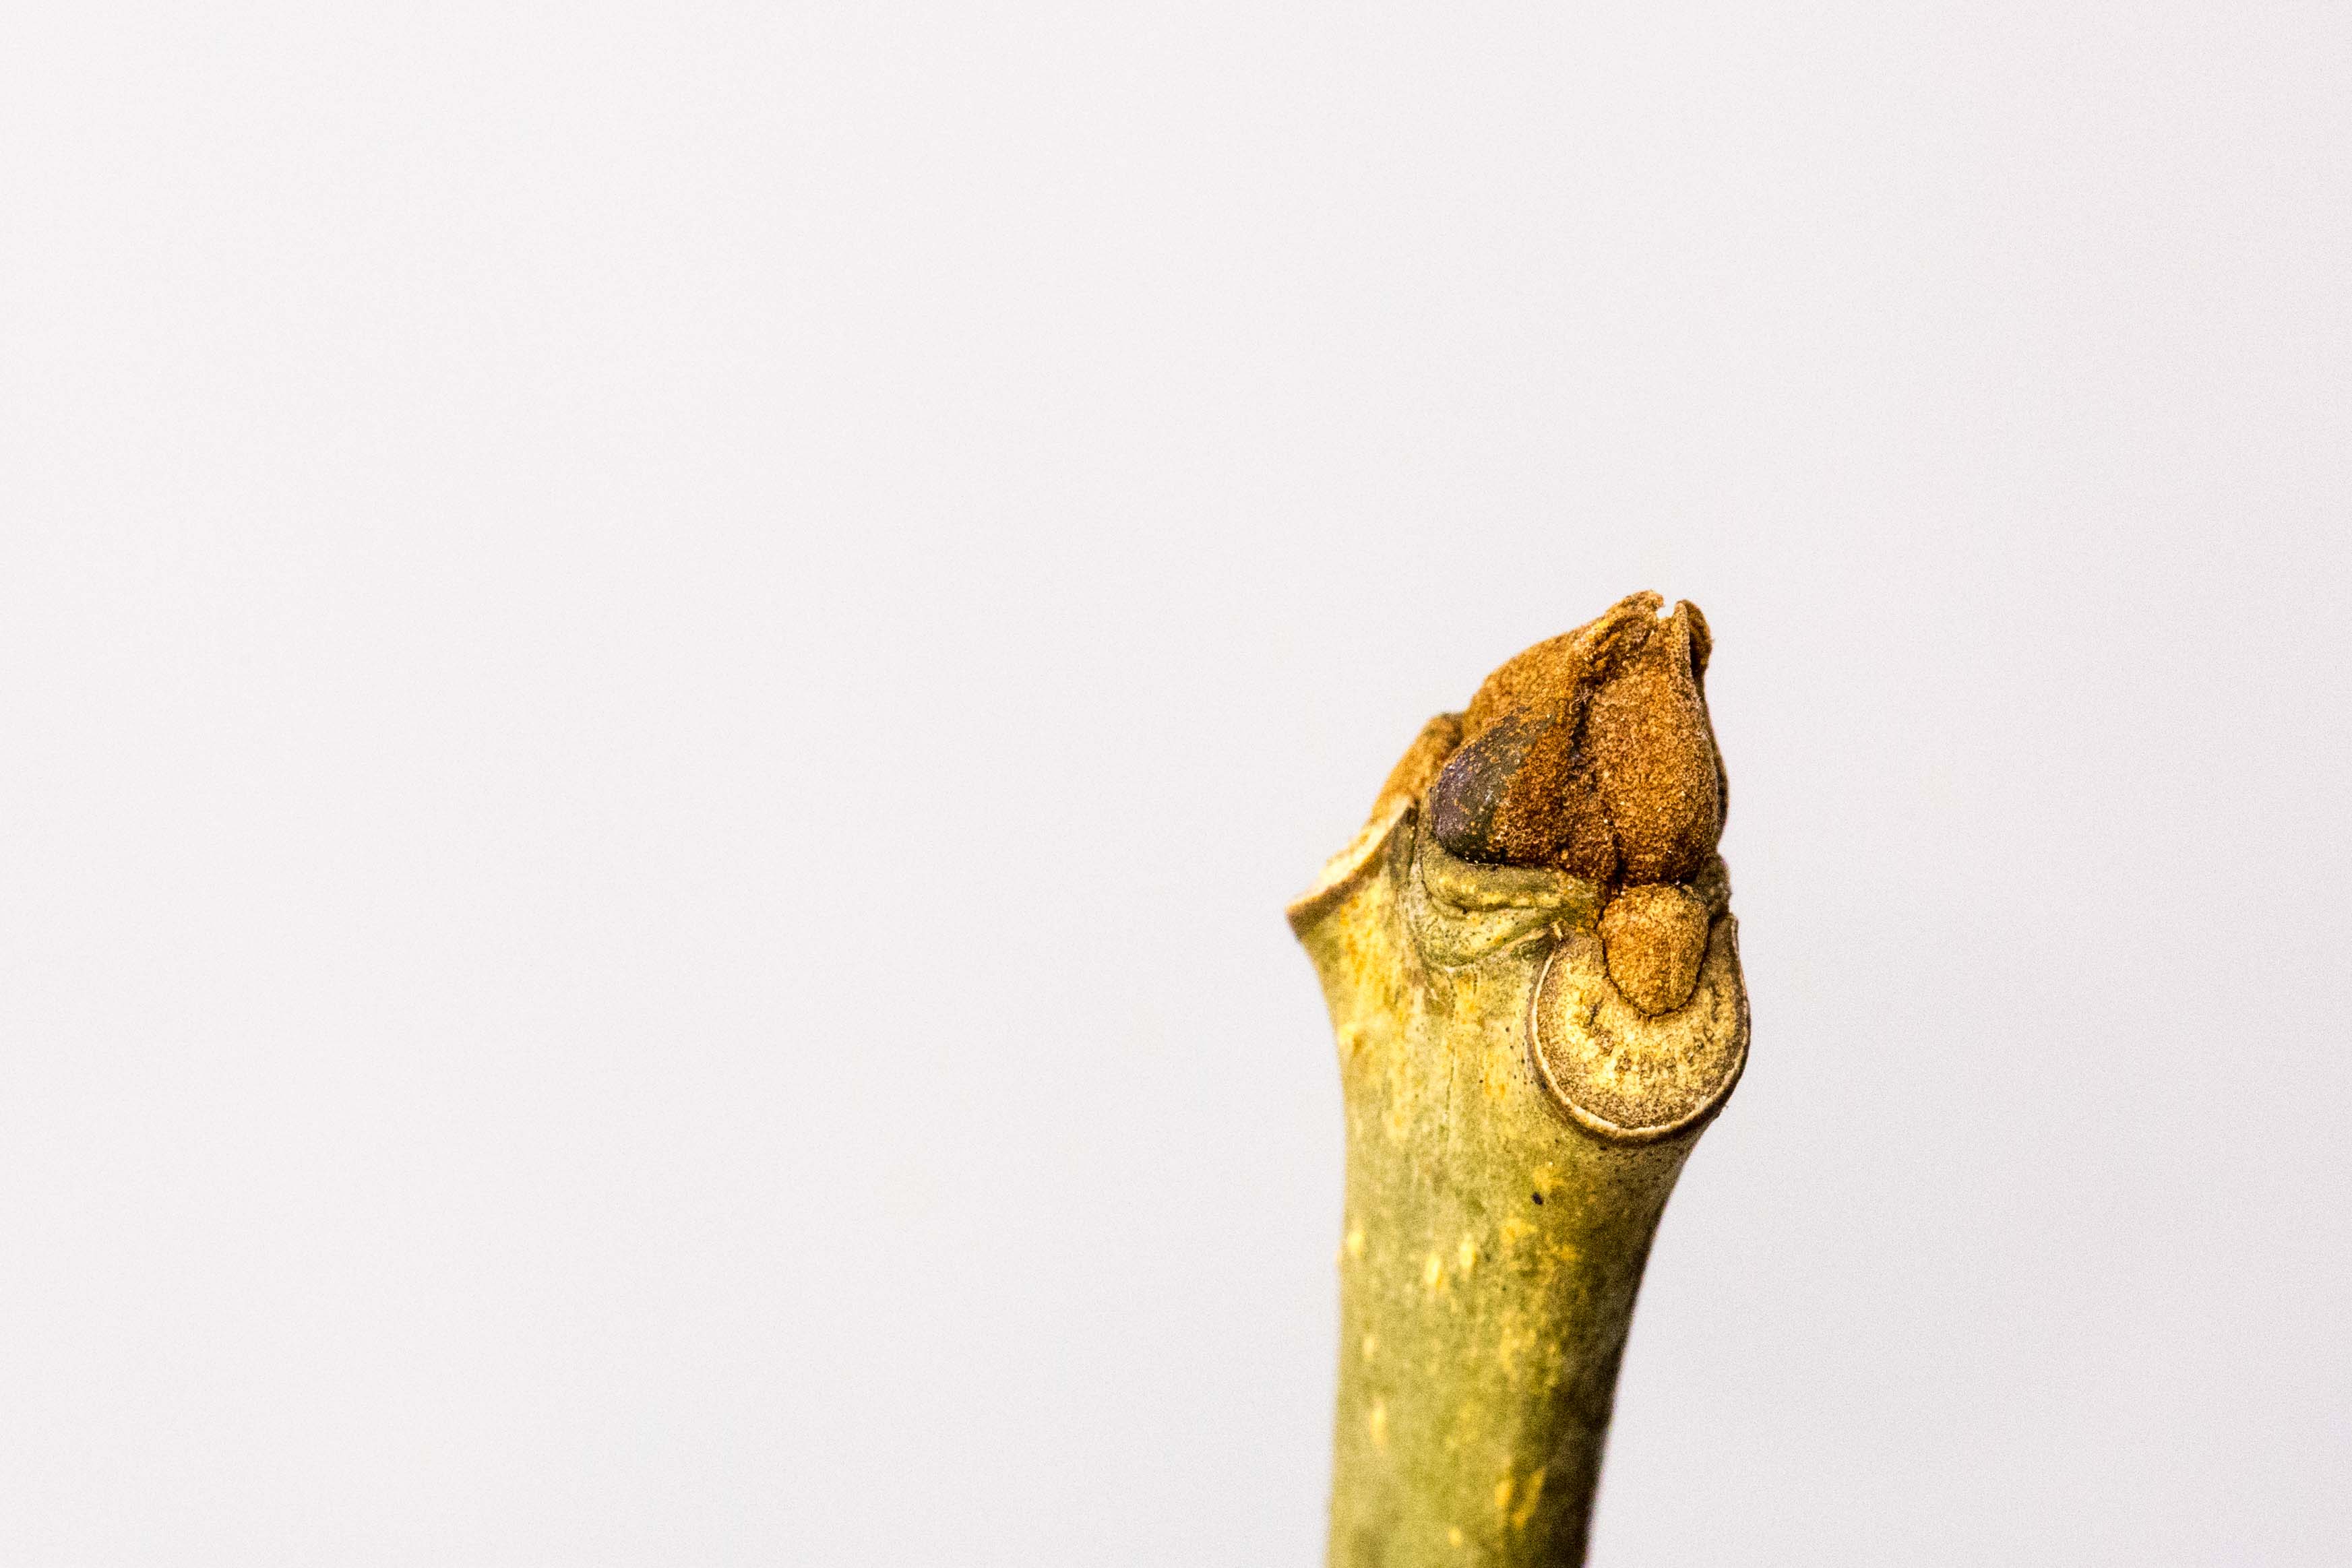
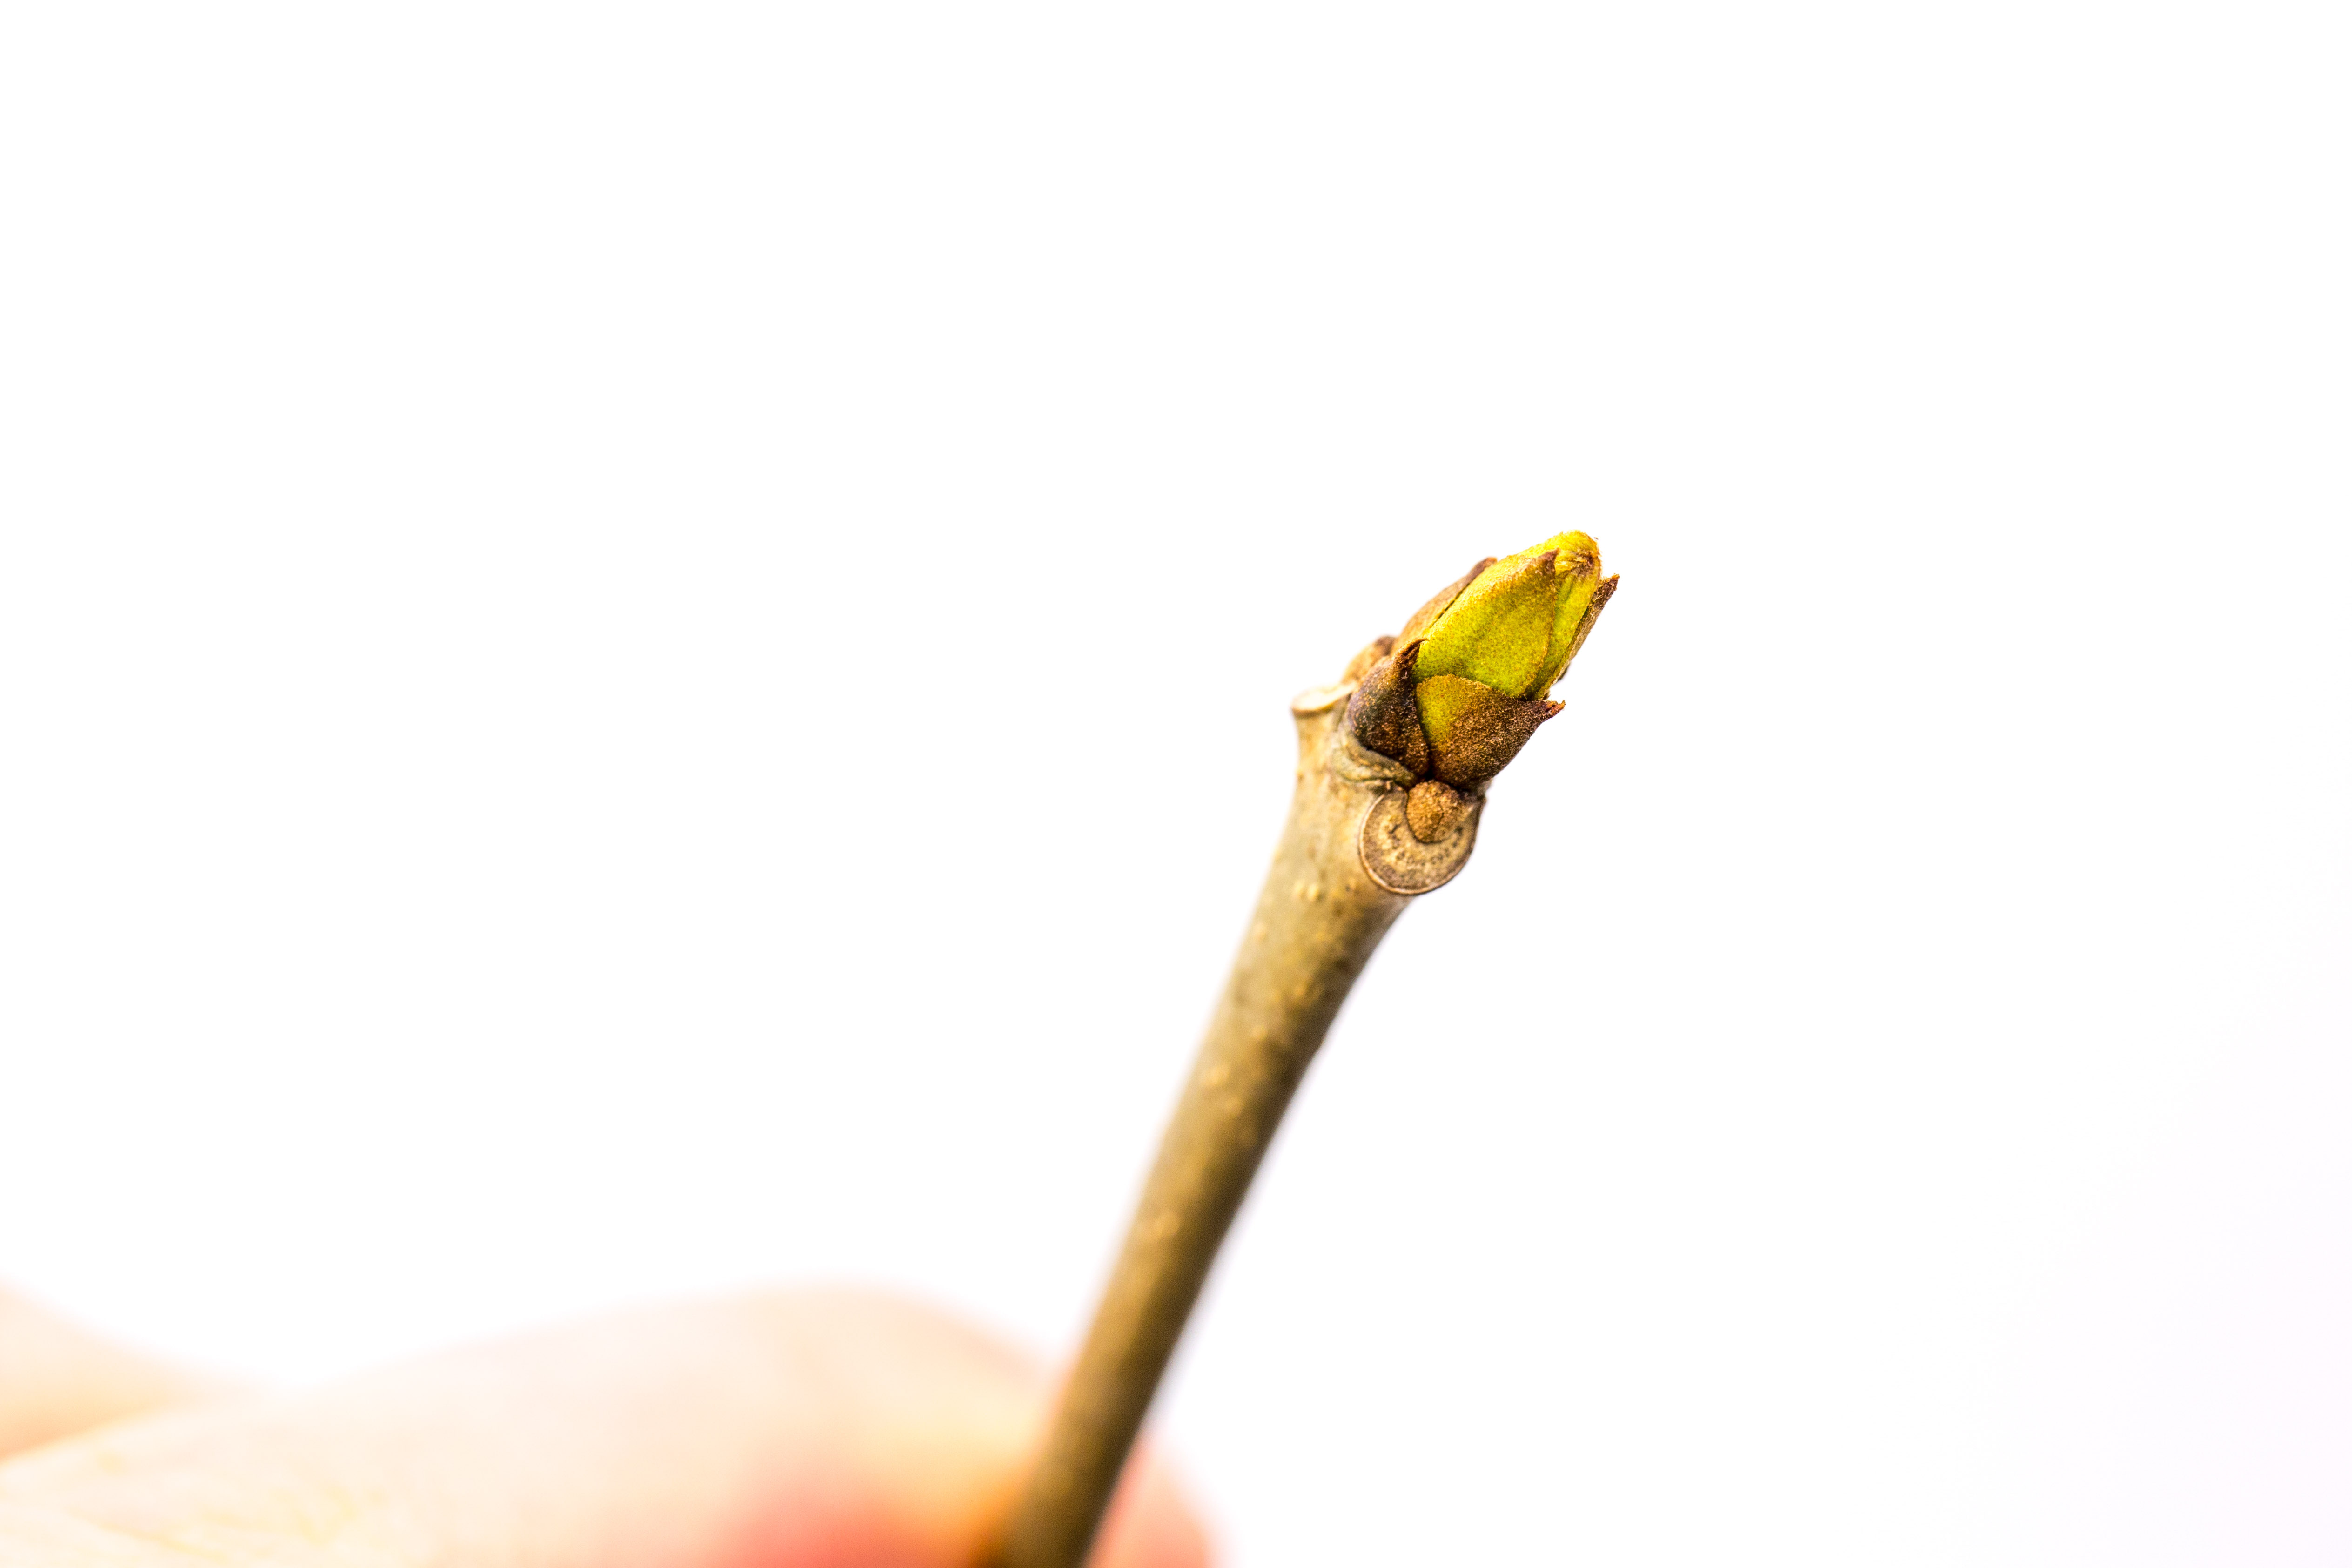
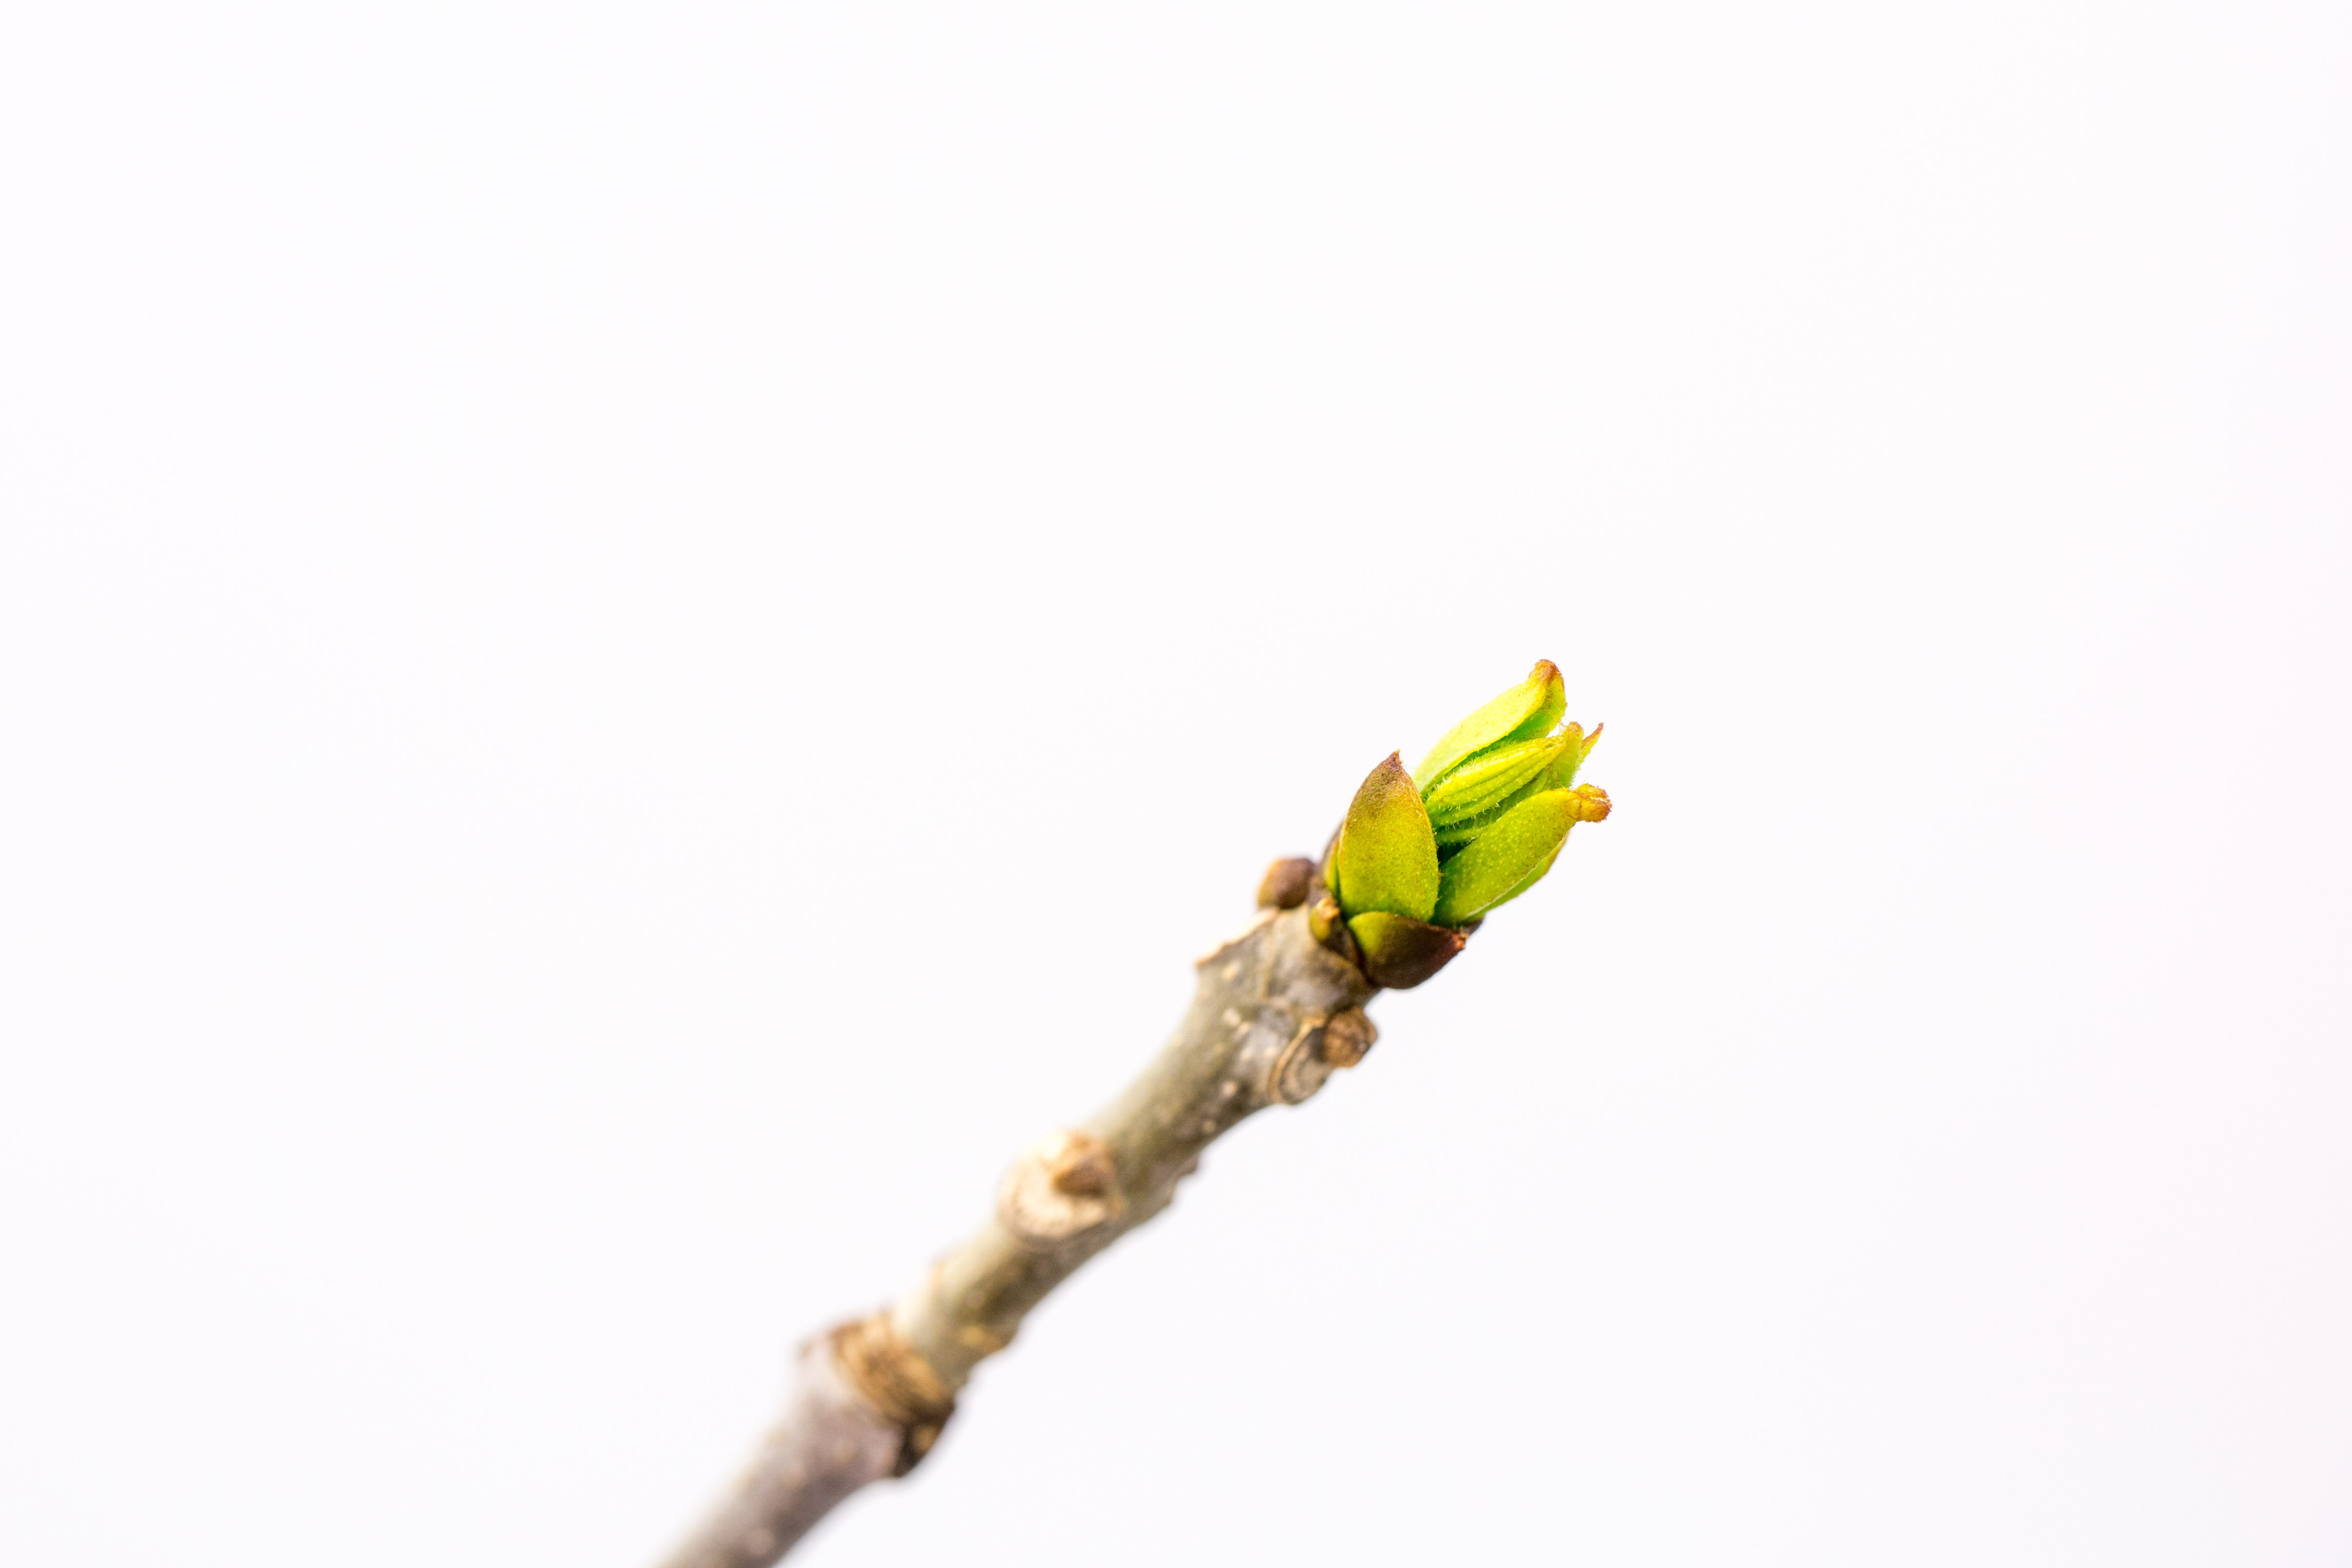
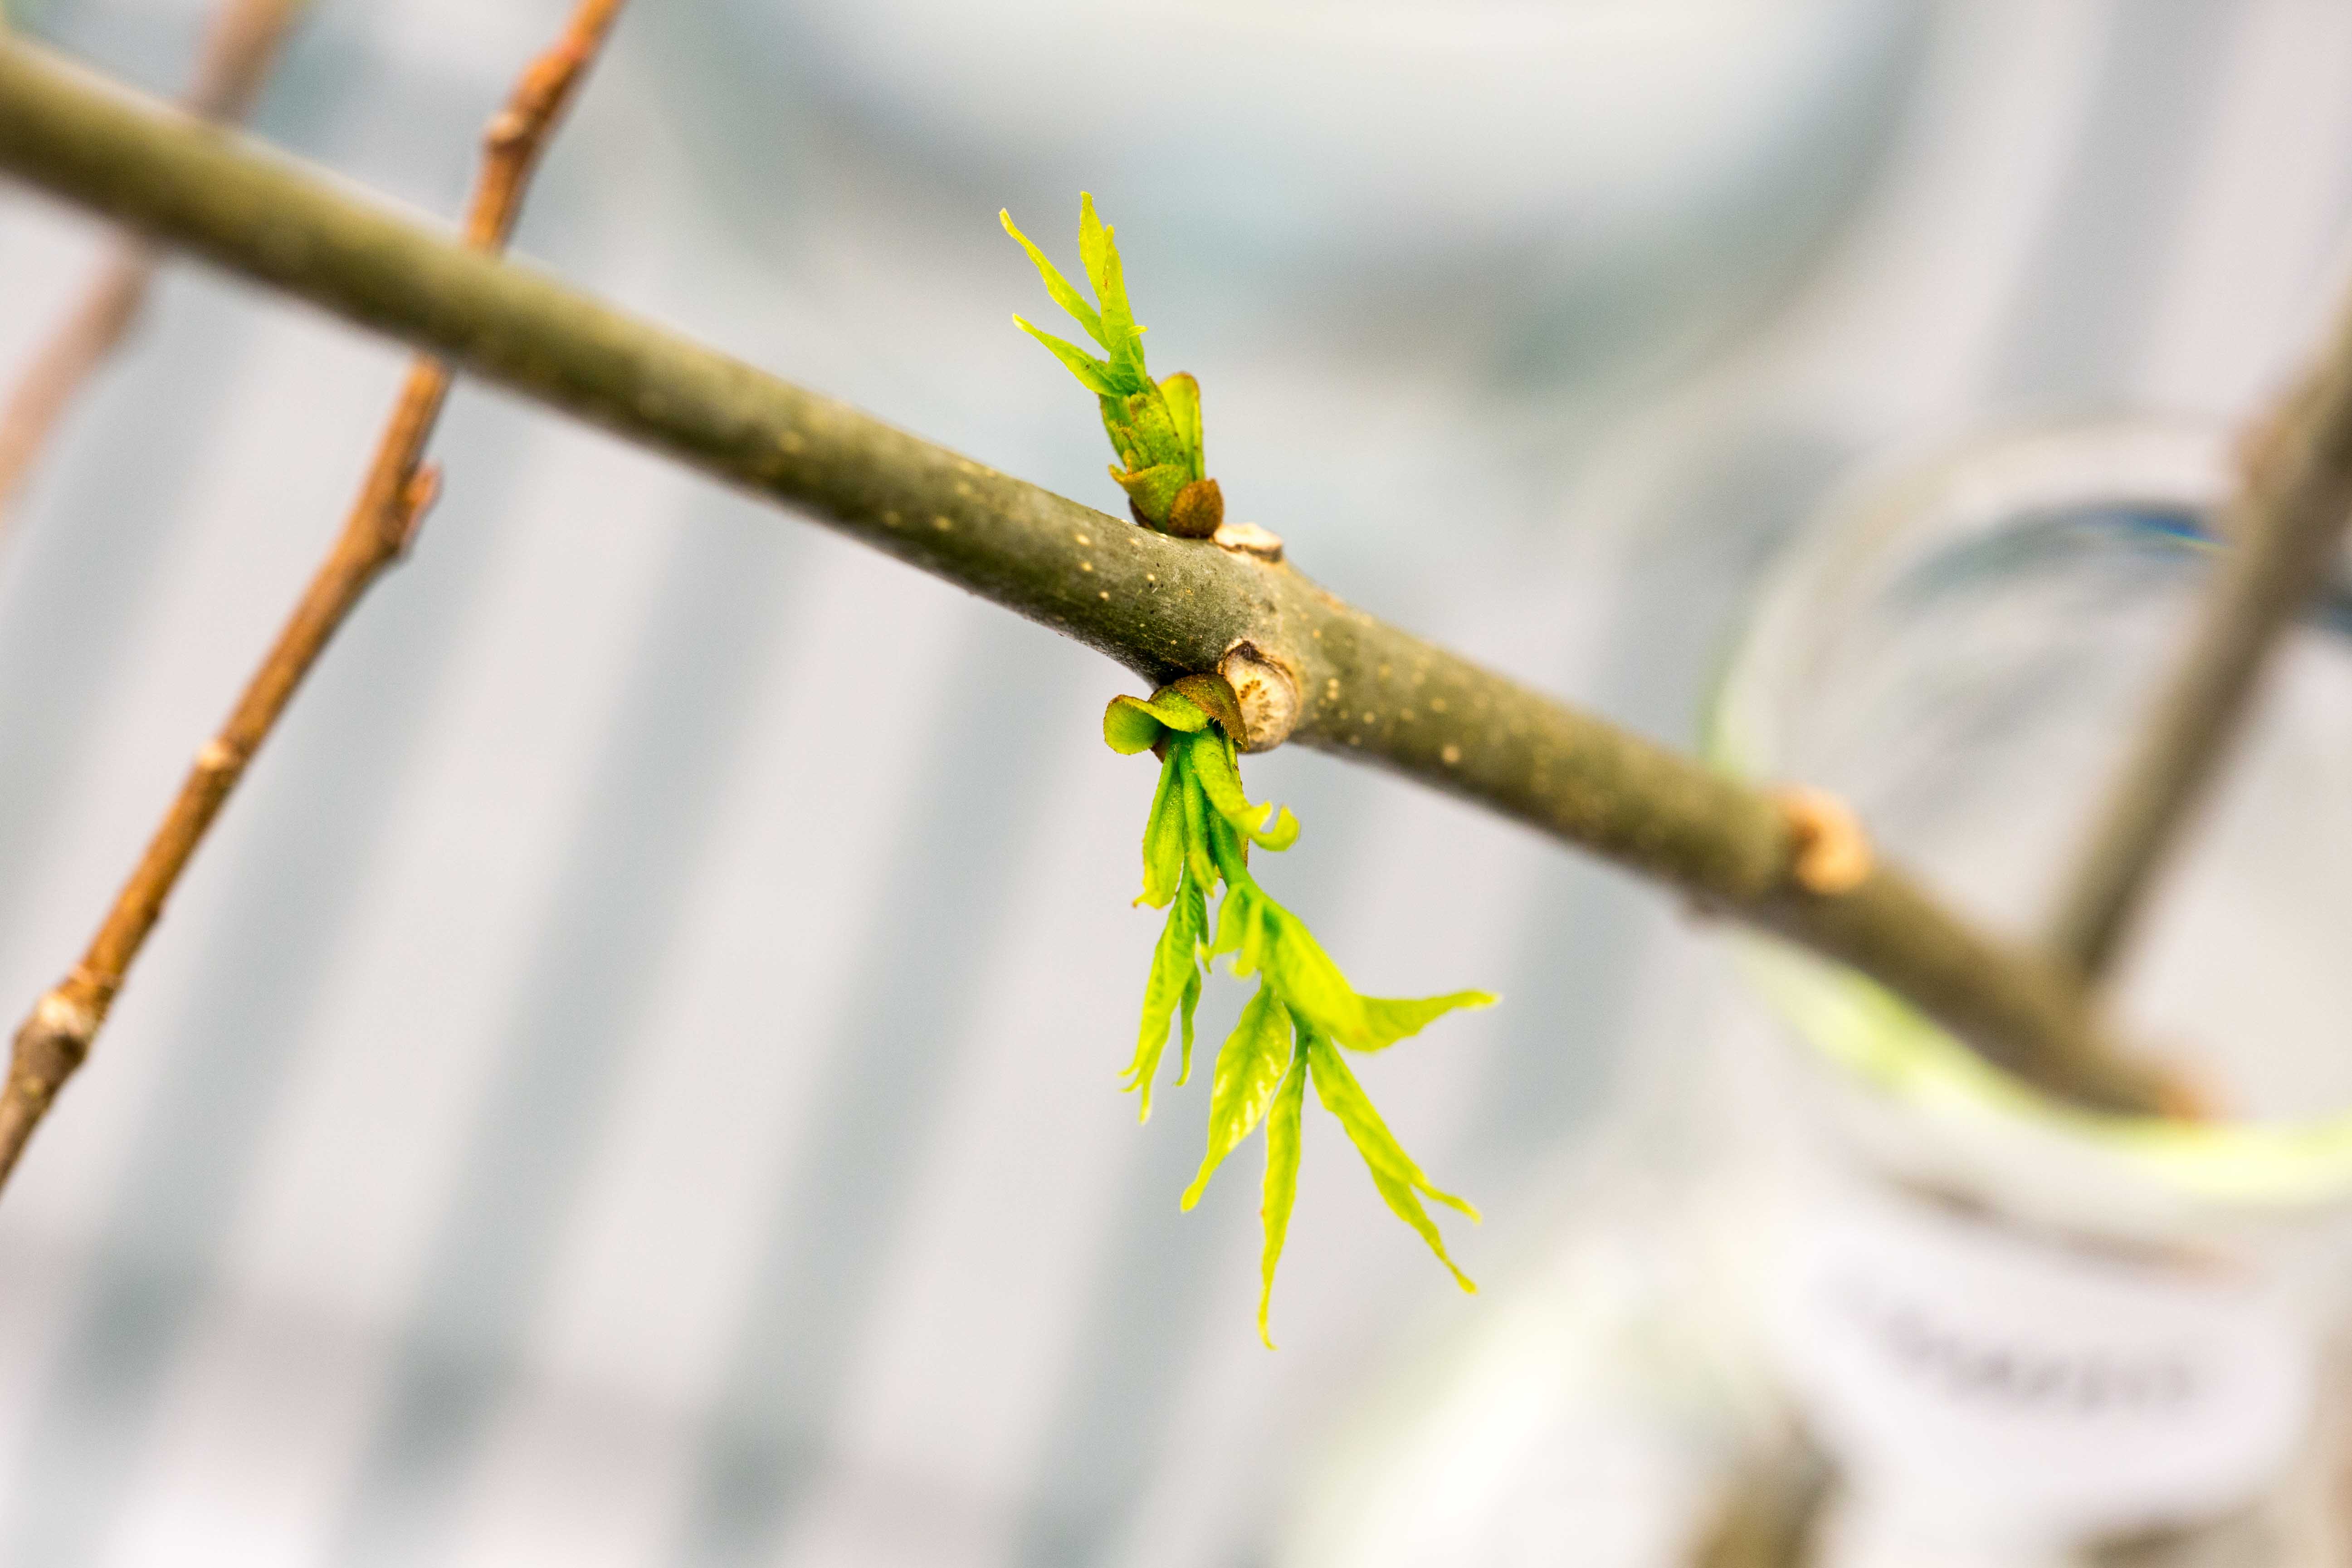
In order to ensure my measurements were standardized, I referenced phenology rubrics that allocated a value to an observed growth stage. I found that most of these rubrics, even the best ones like the BBCH guide, weren't quite capturing the beauty and architecture of our 35 species' plant buds. So I deployed my DSLR camera to create my own rubric, which is here.
Our findings are under review. Spoiler alert: day length is a stronger driver than temperature. This may prove to be good news for the durability of ecosystems in the face of global warming. If day length is a stronger driver of phenology than temperature, as climate change causes spring temperatures to rise, these phenological events (and the cascade of ecological processes influenced by them) may endure.
At the very least, if climate change does go on to cause some calamitous global natural disaster, testing the survivability of economies, governments, and civilization itself, I'll be the guy who knows where all the blueberries are.