A Standardized Photographic Guide to Woody Plant Spring Phenology
Alongside biological time lapse photography, A standardized photographic guide to woody plant spring phenology was developed under Dr. Lizzie Wolkovich's Temporal Ecology Lab at Harvard University. I created the guide as a visual rubric for measuring the growth stages of 31 woody plant species, from bud dormancy to leaf-out.
Full Guide — A standardized photographic guide to woody plant spring phenology
As a researcher with the Temporal Ecology Lab, I studied the morphology of 31 woody species while they formed their spring leaves in our growth chamber experiments. Early in the work, I was frustrated by how standard rubrics in the literature conveyed these changes as mere illustrations and tables, like Finn et al.'s. Tasked with recording over 40,000 morphological measurements of the sort, I sensed that a more visually accurate rubric, by way of digital photography, would improve my group's research.
Rail Deployment
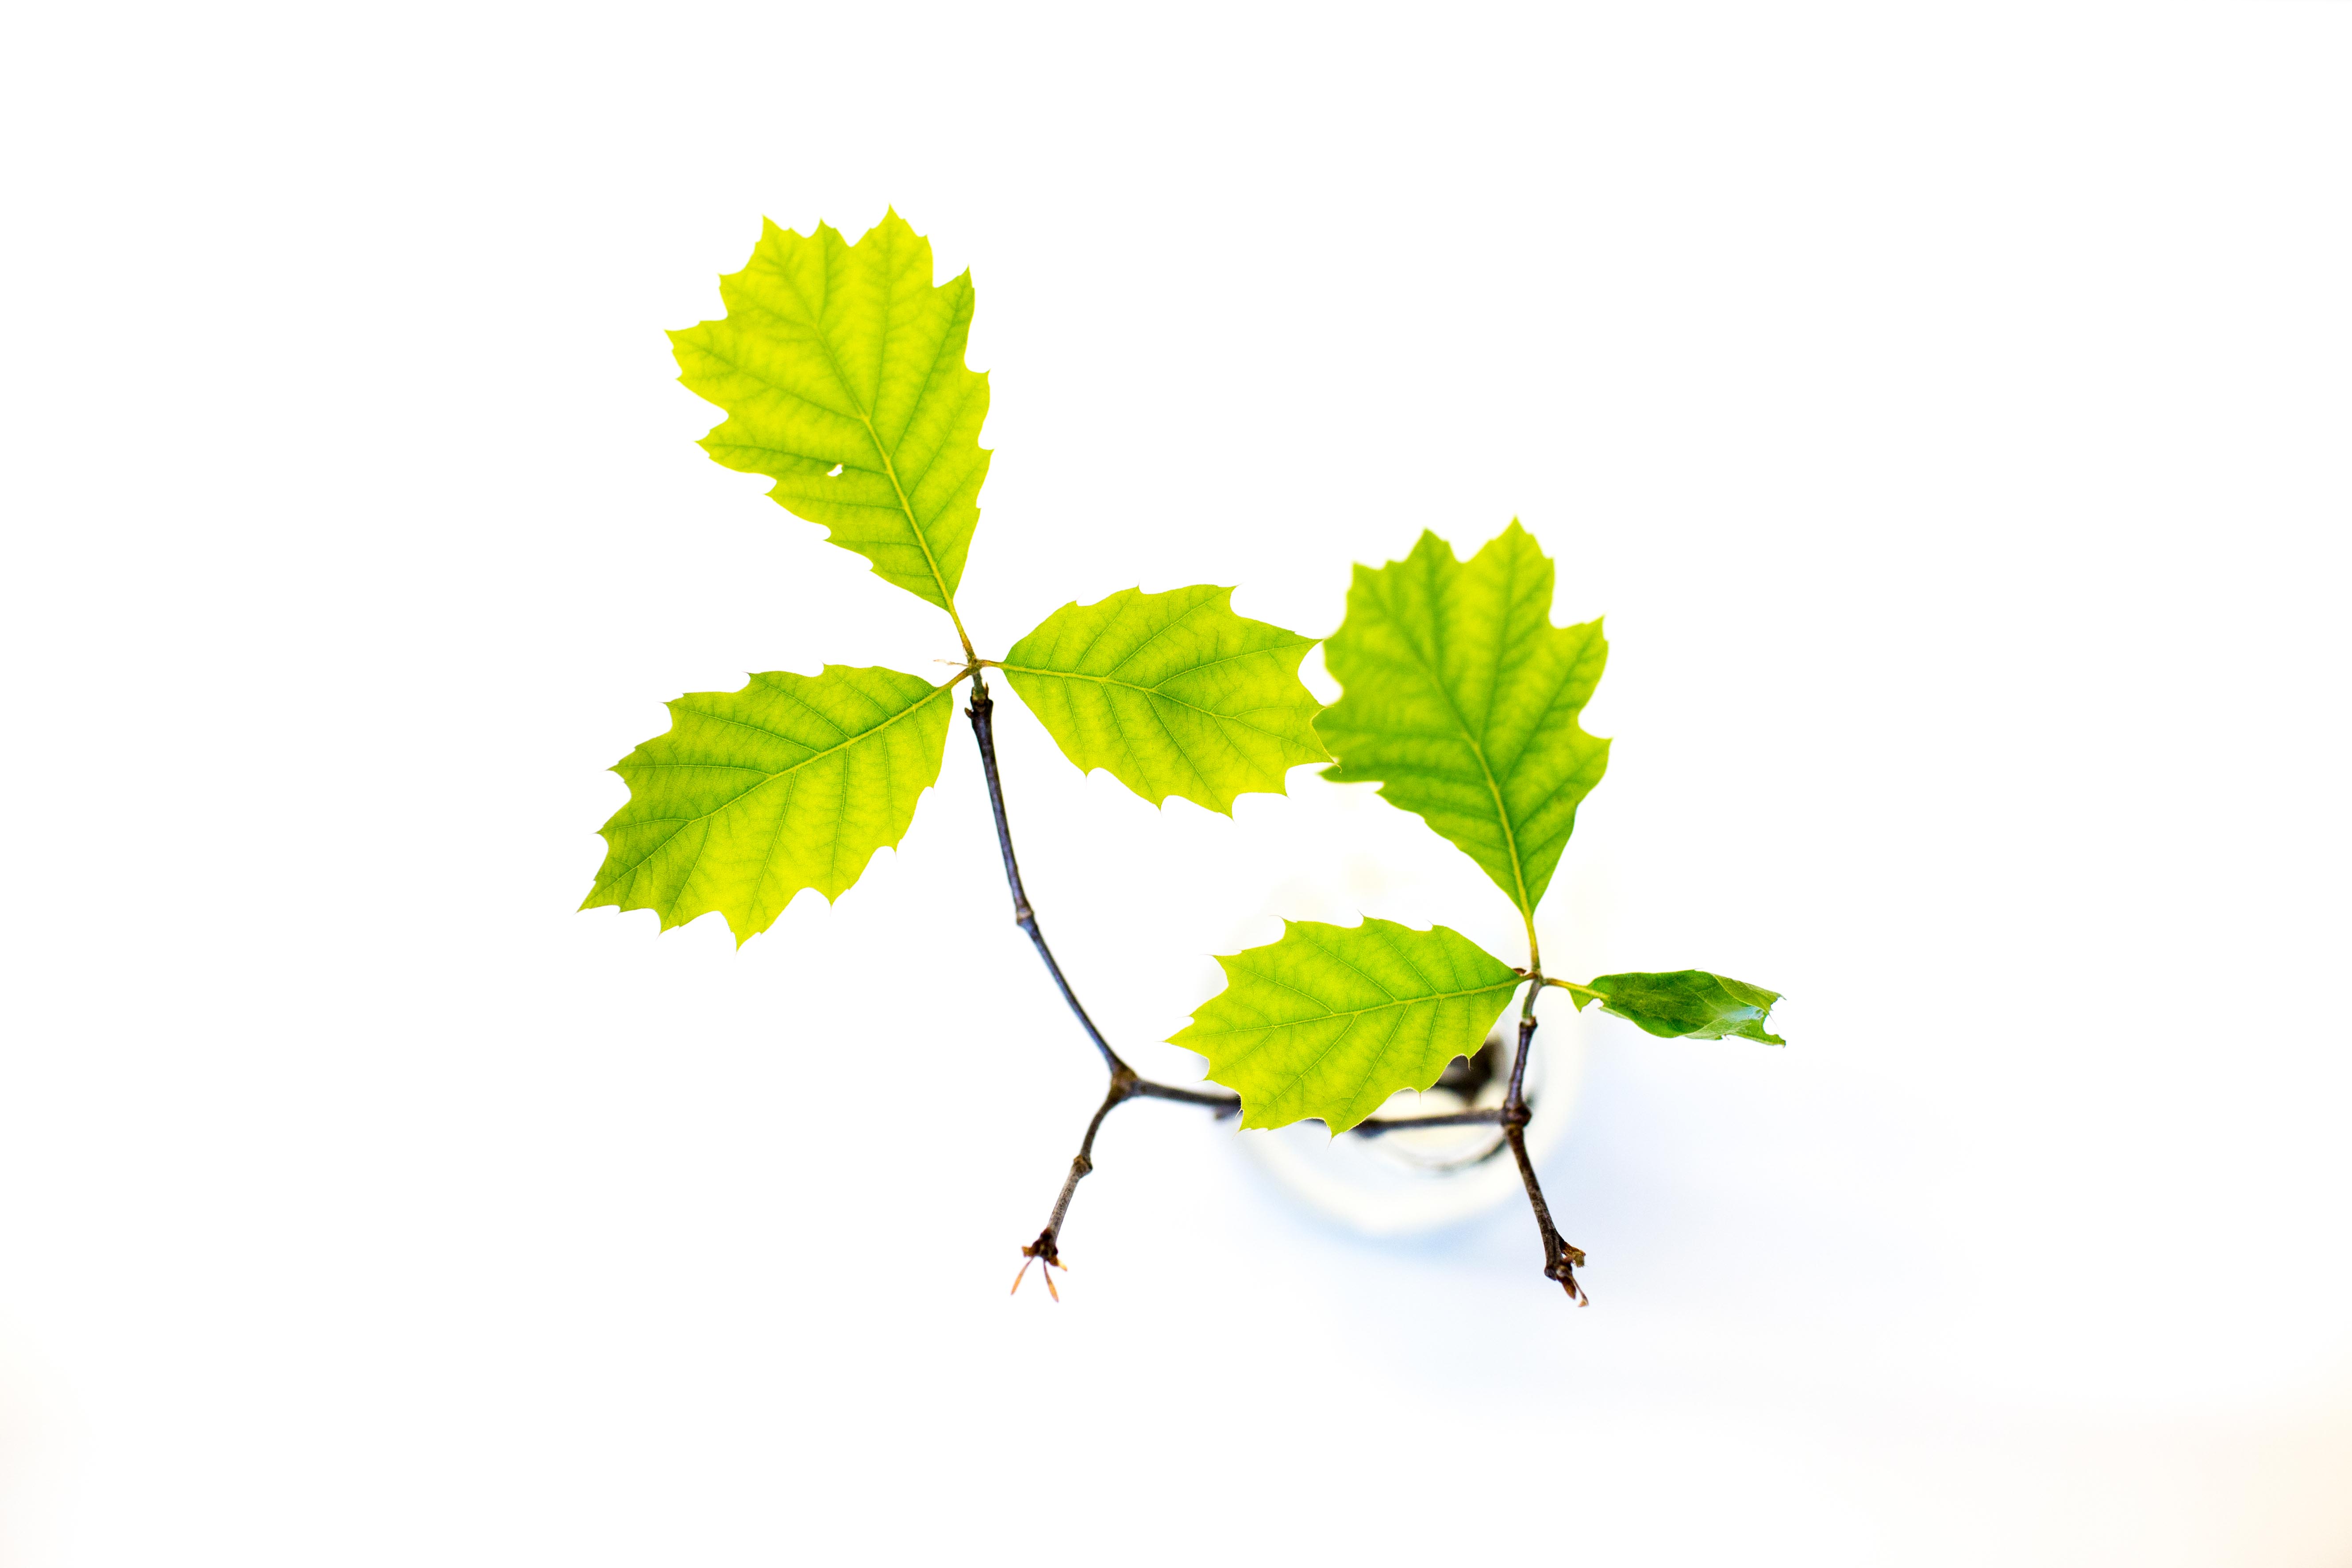
My camera rails came in handy for this pursuit. I deployed Tom inside of my growth chambers to capture still images of several plant subjects at once, across the length of their growth cycles. The tool allowed for a single camera to do the job of many at once. Its computational and mechanical abilities were similar to those of my respiration chambers, in that they allowed me to capture a 24-hour data set for an application once limited by manual data collection practices.
Temporal Ecology
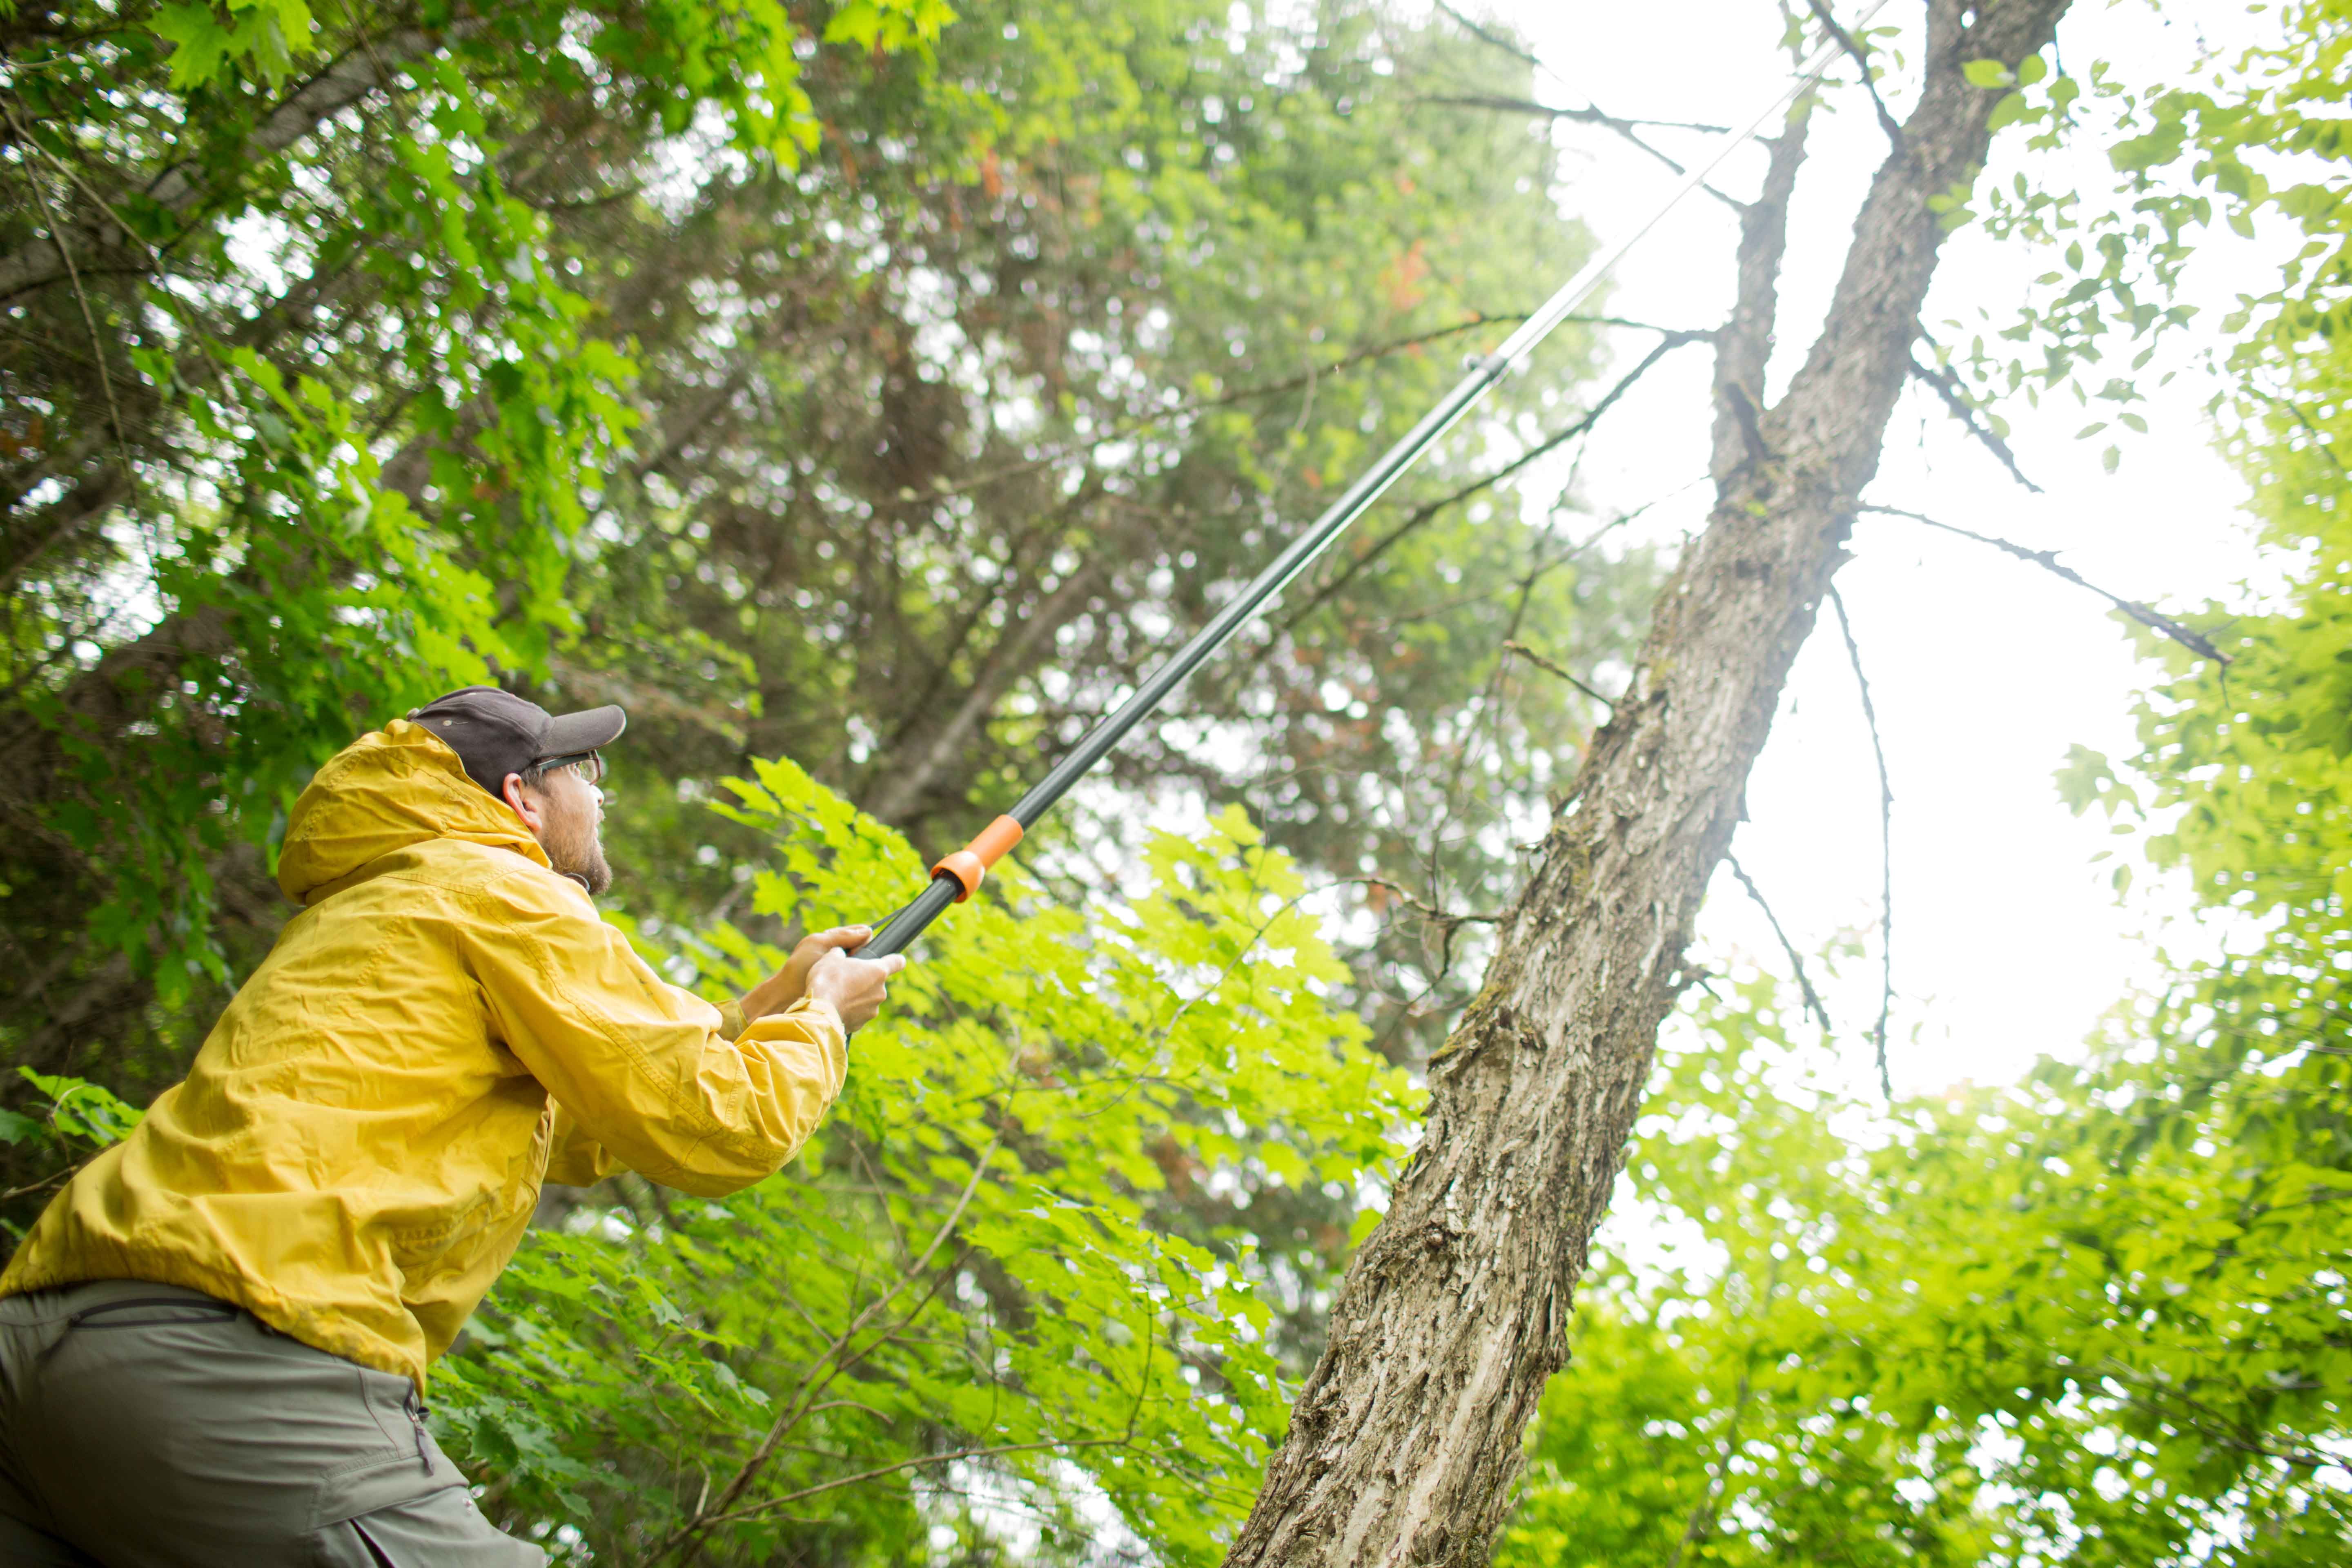
Preparing the plants for their photographic debut was a task in itself. I trecked across four field sites during winter, from Boston to Montreal, scavenging for the 31 distinct and often rare woody plant species. It was kind of like Pokémon, except if I’d failed, I couldn’t pay rent. When I started the field work, I didn’t know any plant identification. Not long into it, I could spot a dormant Populus grandidentata from 50 yards out. For me, this photo catalog is not just a scientific reference, but evidence that real expertise in a domain is just on the other side of hard work.
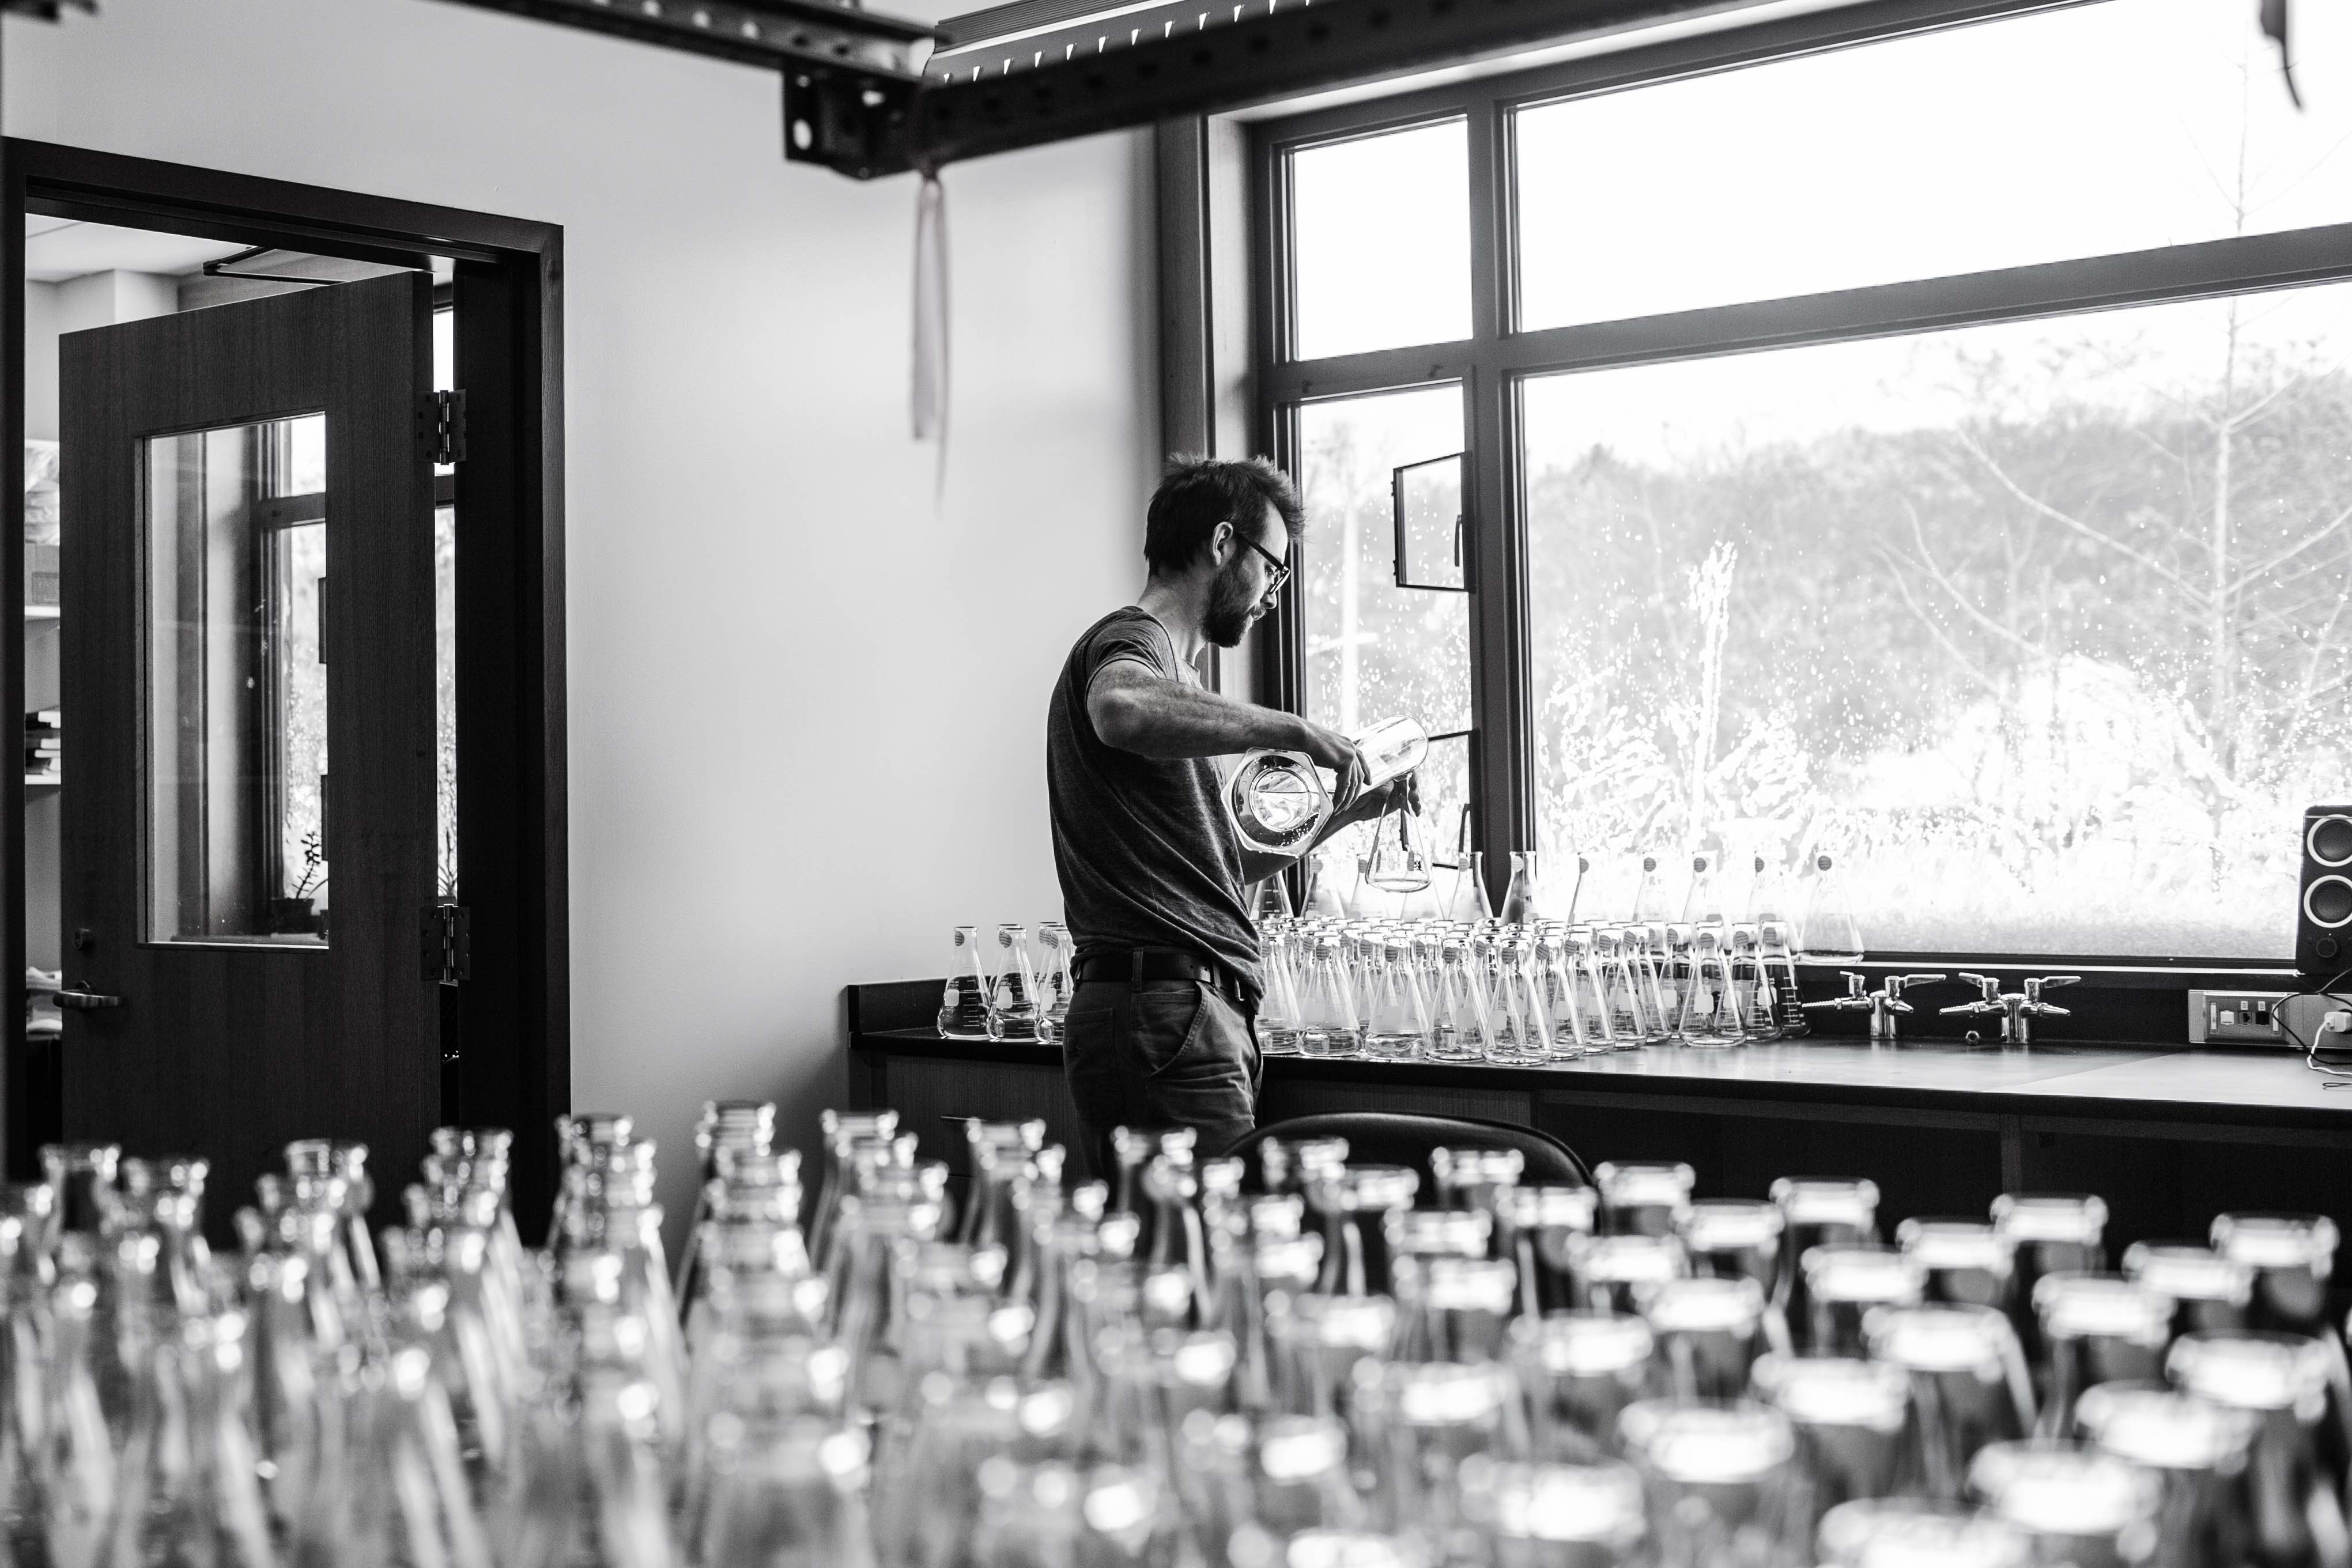
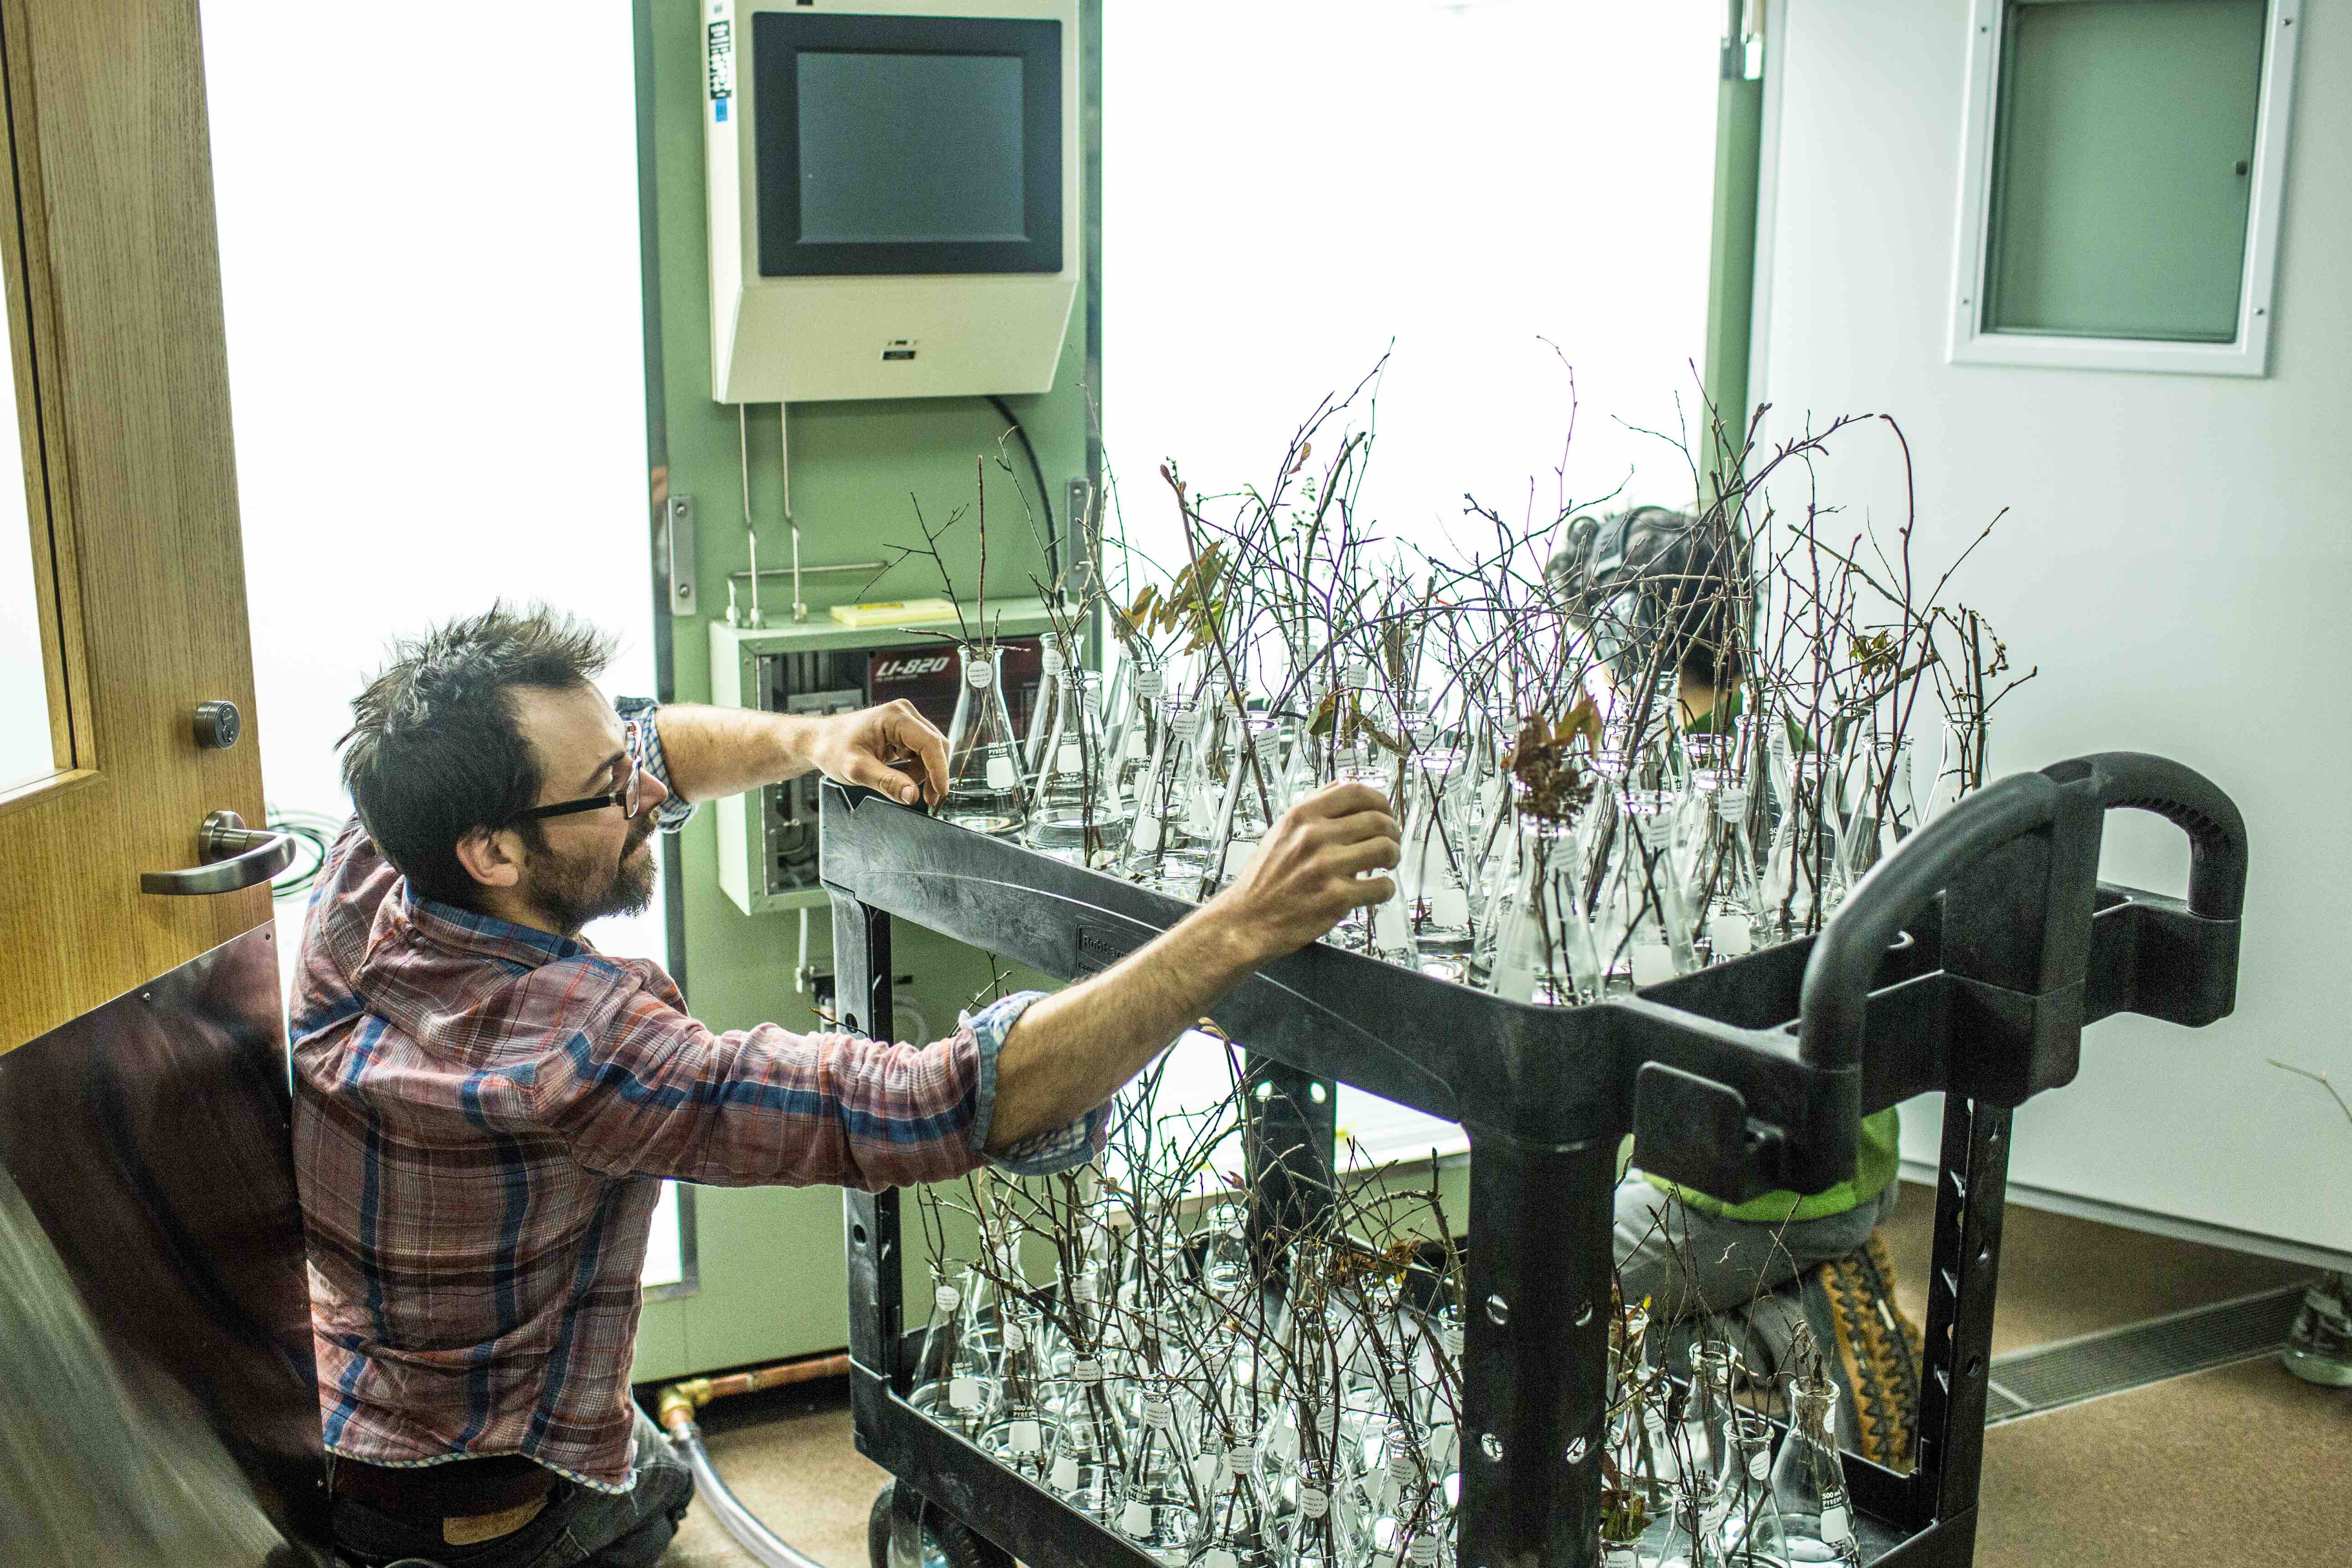
After field collection, I incubated our plant samples in closed environment chambers, testing for their growth response to various photoperiods and temperatutes. Postdoc and research partner, Dr. Dan Flynn, pictured above prepping samples. Ultimately our lab was sleuthing for answers to the question of which of these species would be most vulnerable to impending warming temperatures brought by climate change.
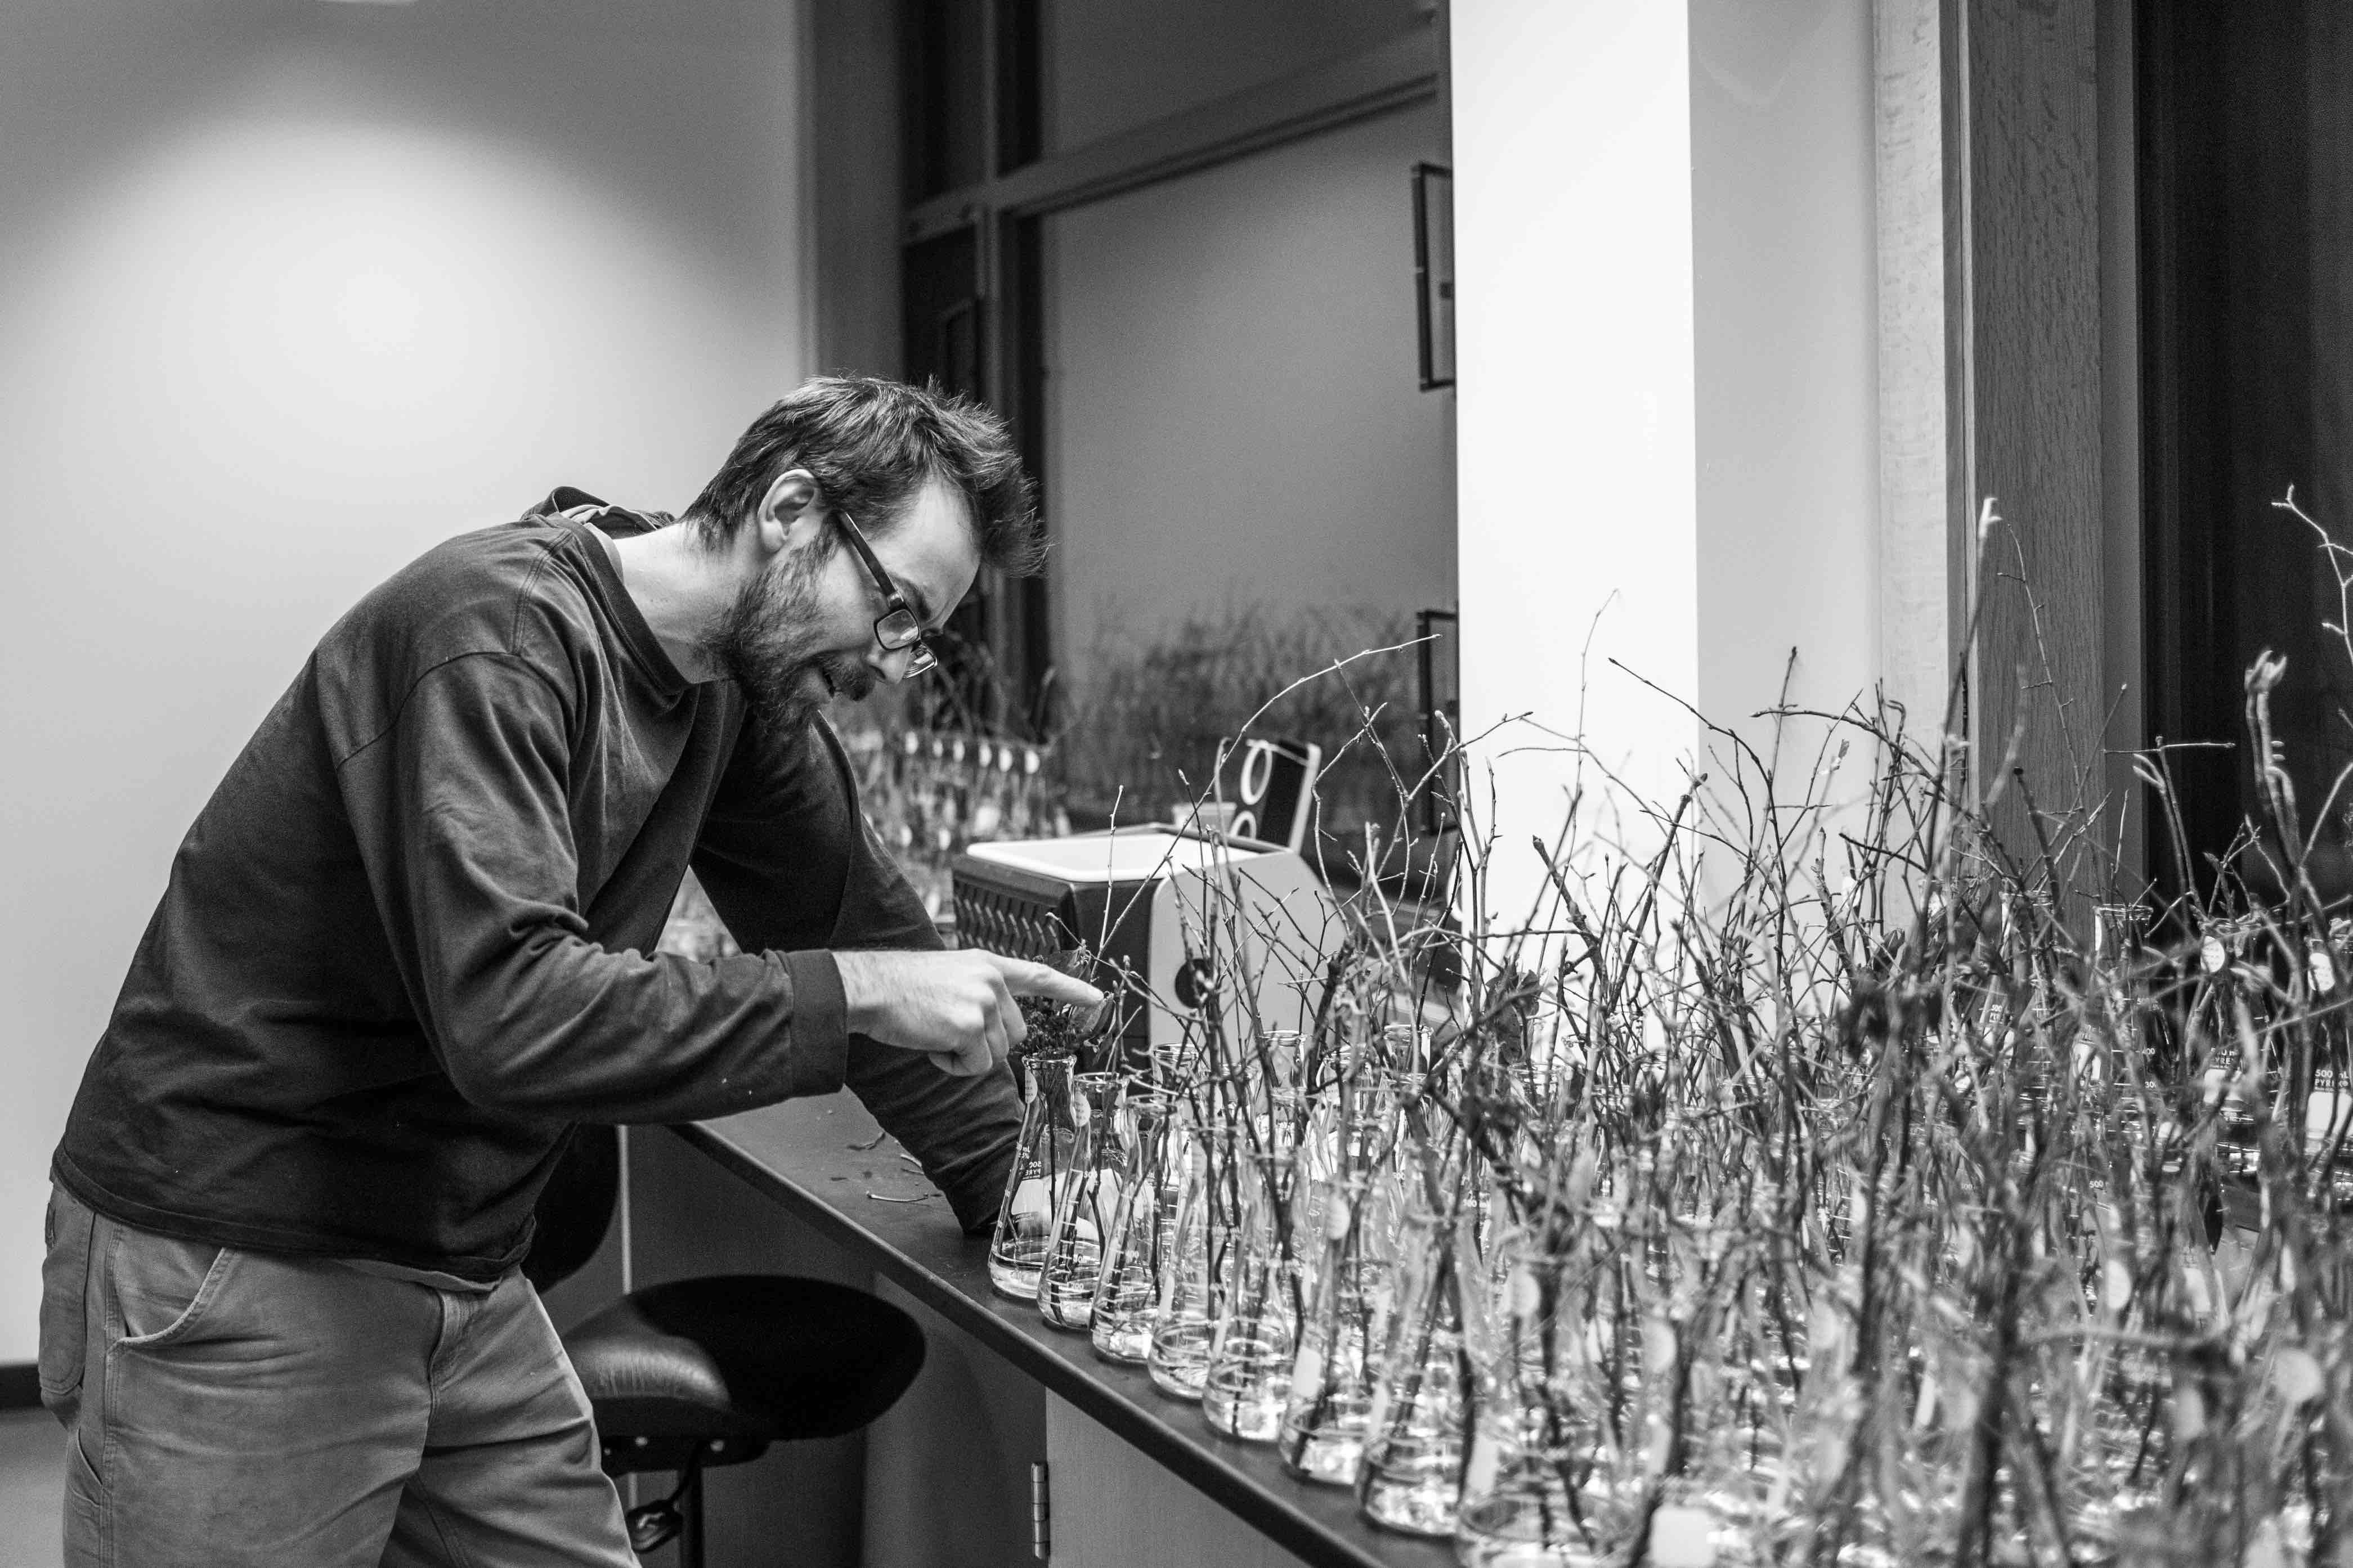
Over the course of our two-year experiment, I took twice-weekly observational measurements of our cuttings inside of their chambers, averaging 800 measurements at once. Dormant bud, first leaf, second leaf, first flower. I got to know this morphological language quite well, along with the insufficiencies of my previous reference tables. After building my own photographic catalog, the research proceeded even more swiftly, and with more accurate data in the end. The high resolution images facilitated my translation of subjective observations to objective data, a recurring challenge for ecology researchers beyond my own lab.
Decoding Plants
This project was ultimately a precursor to my role at OpenAg, where I now build computational and mechanical tools to improve our understanding of the plant world, full-time. Analogous to the morphology rubric, the OpenAg team and I deploy environmental sensors––cameras among them!––to decode how plant’s are responding to their environments, springtime and beyond. And along with morphology (e.g. size, flower production), our tools collect and share data on how plant’s express their flavor chemistry, tensile strength, and nutritional content. For this work, we’re designing and
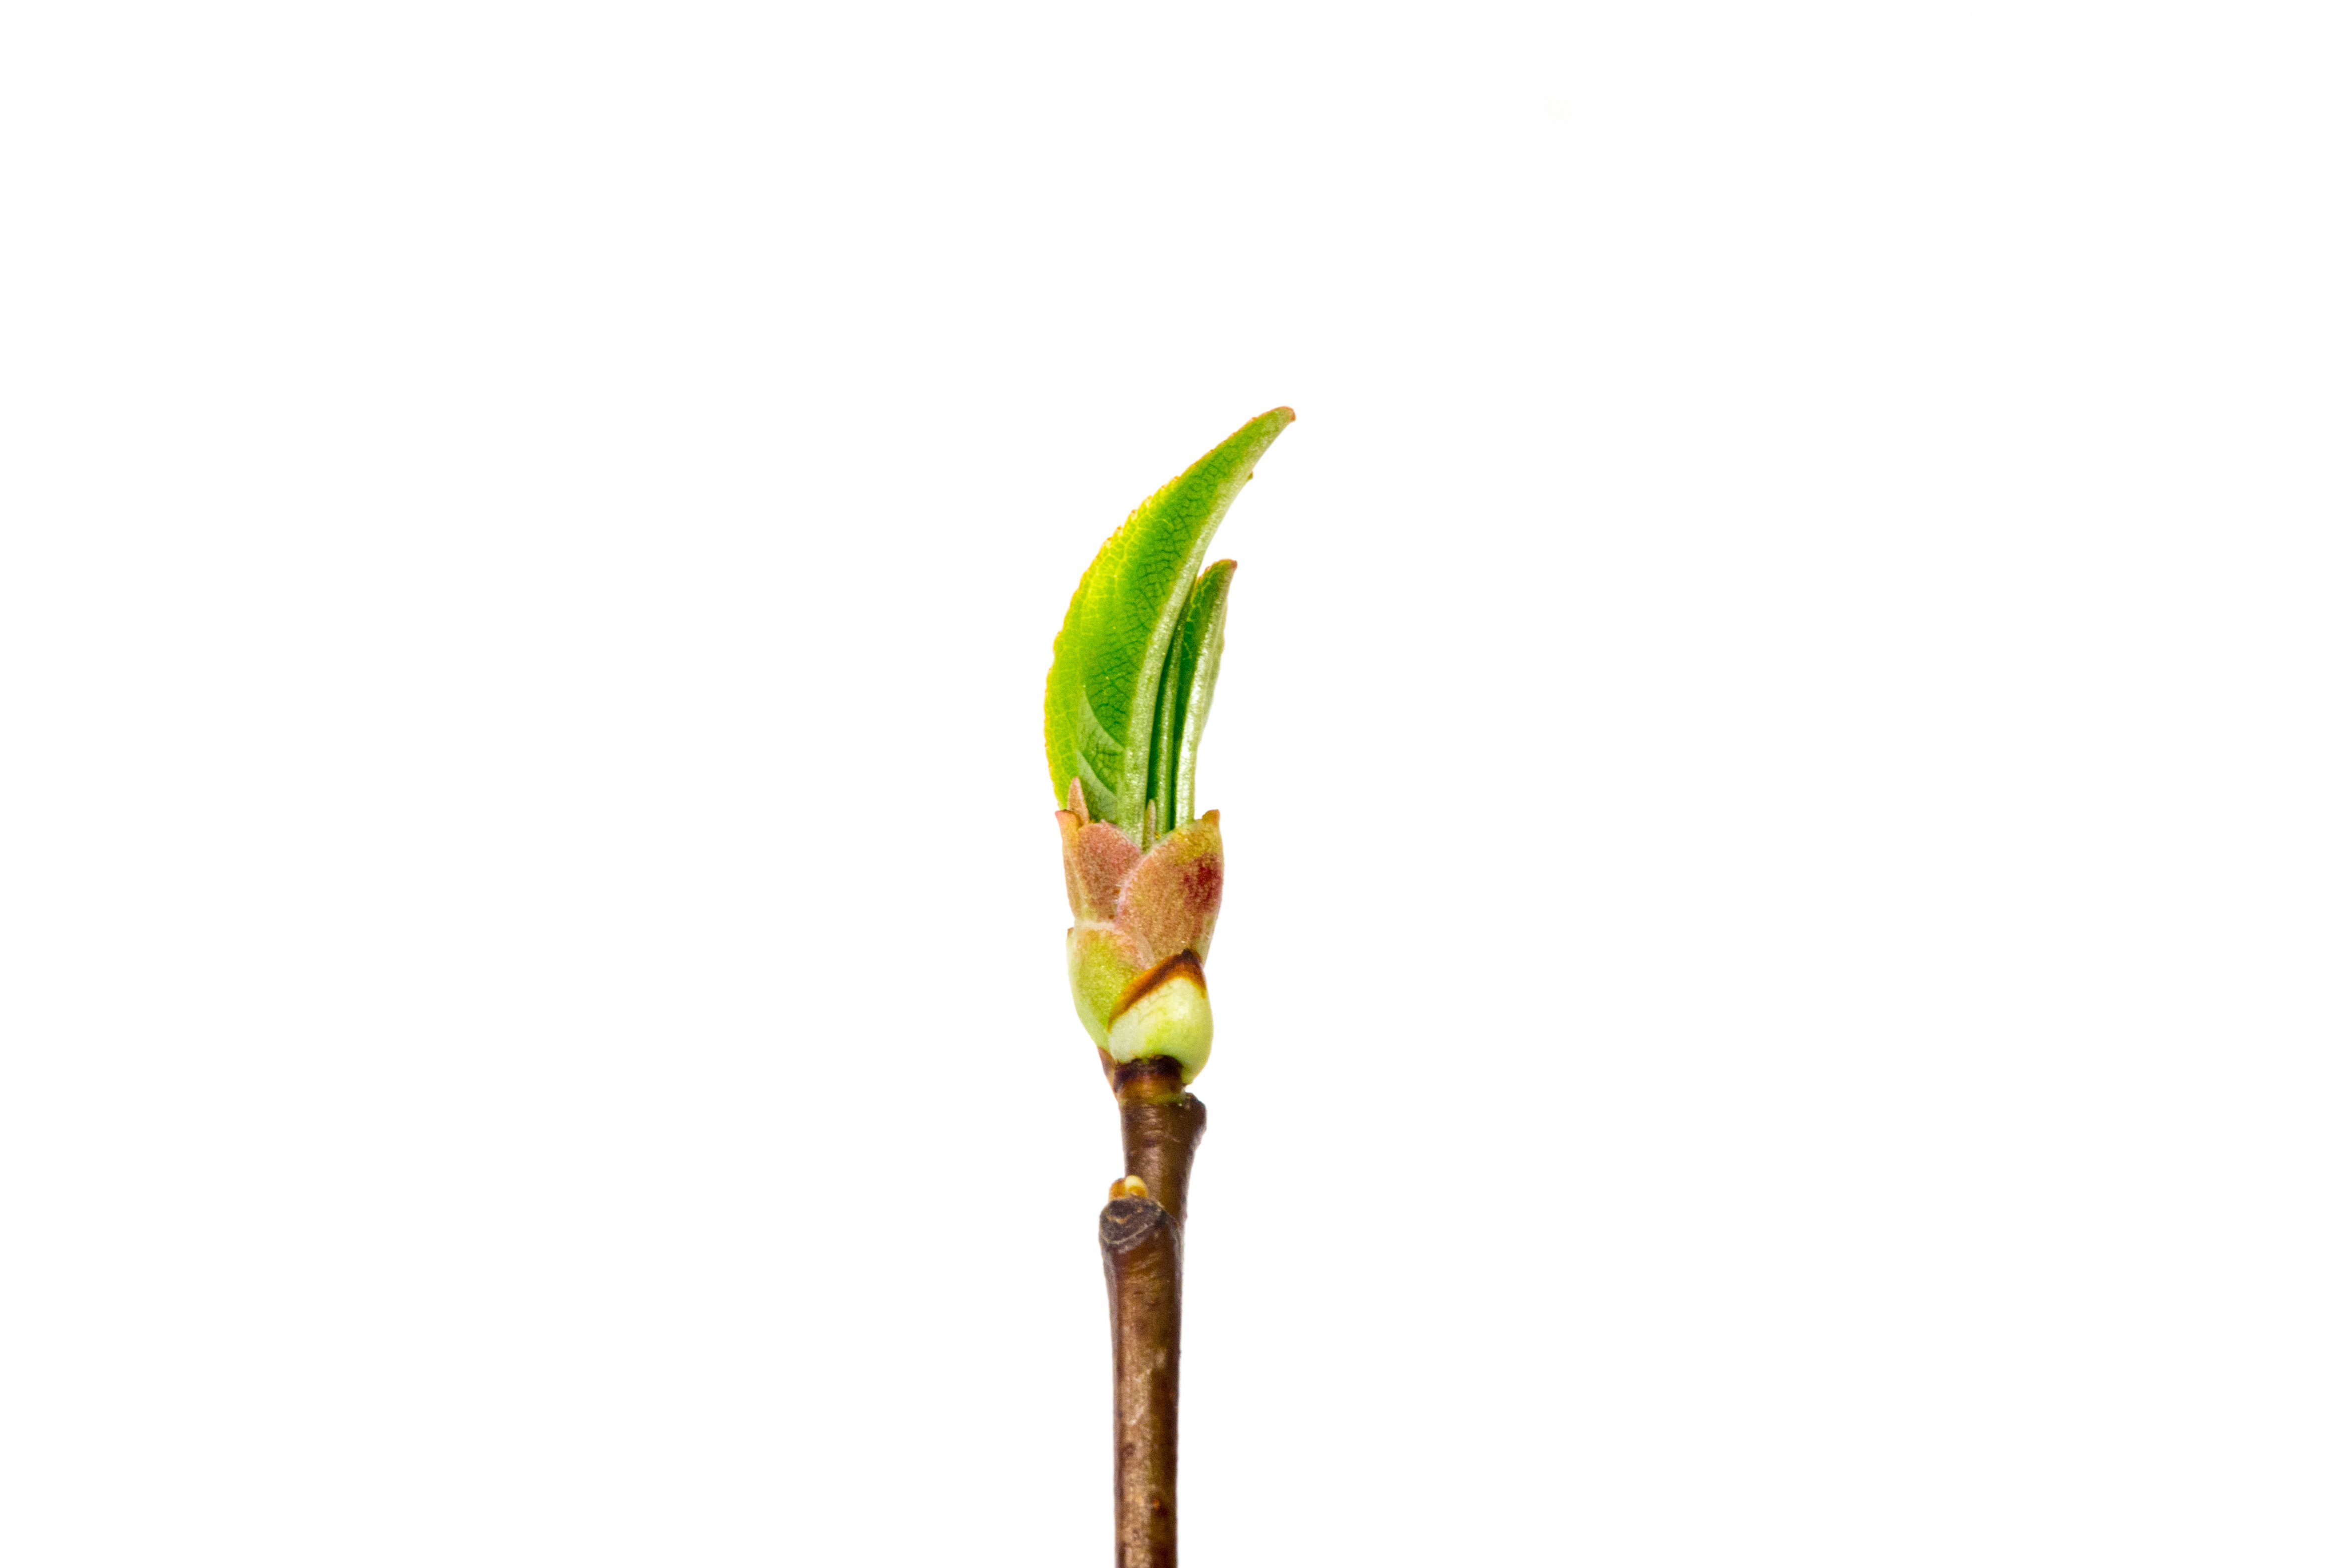
Image Samples
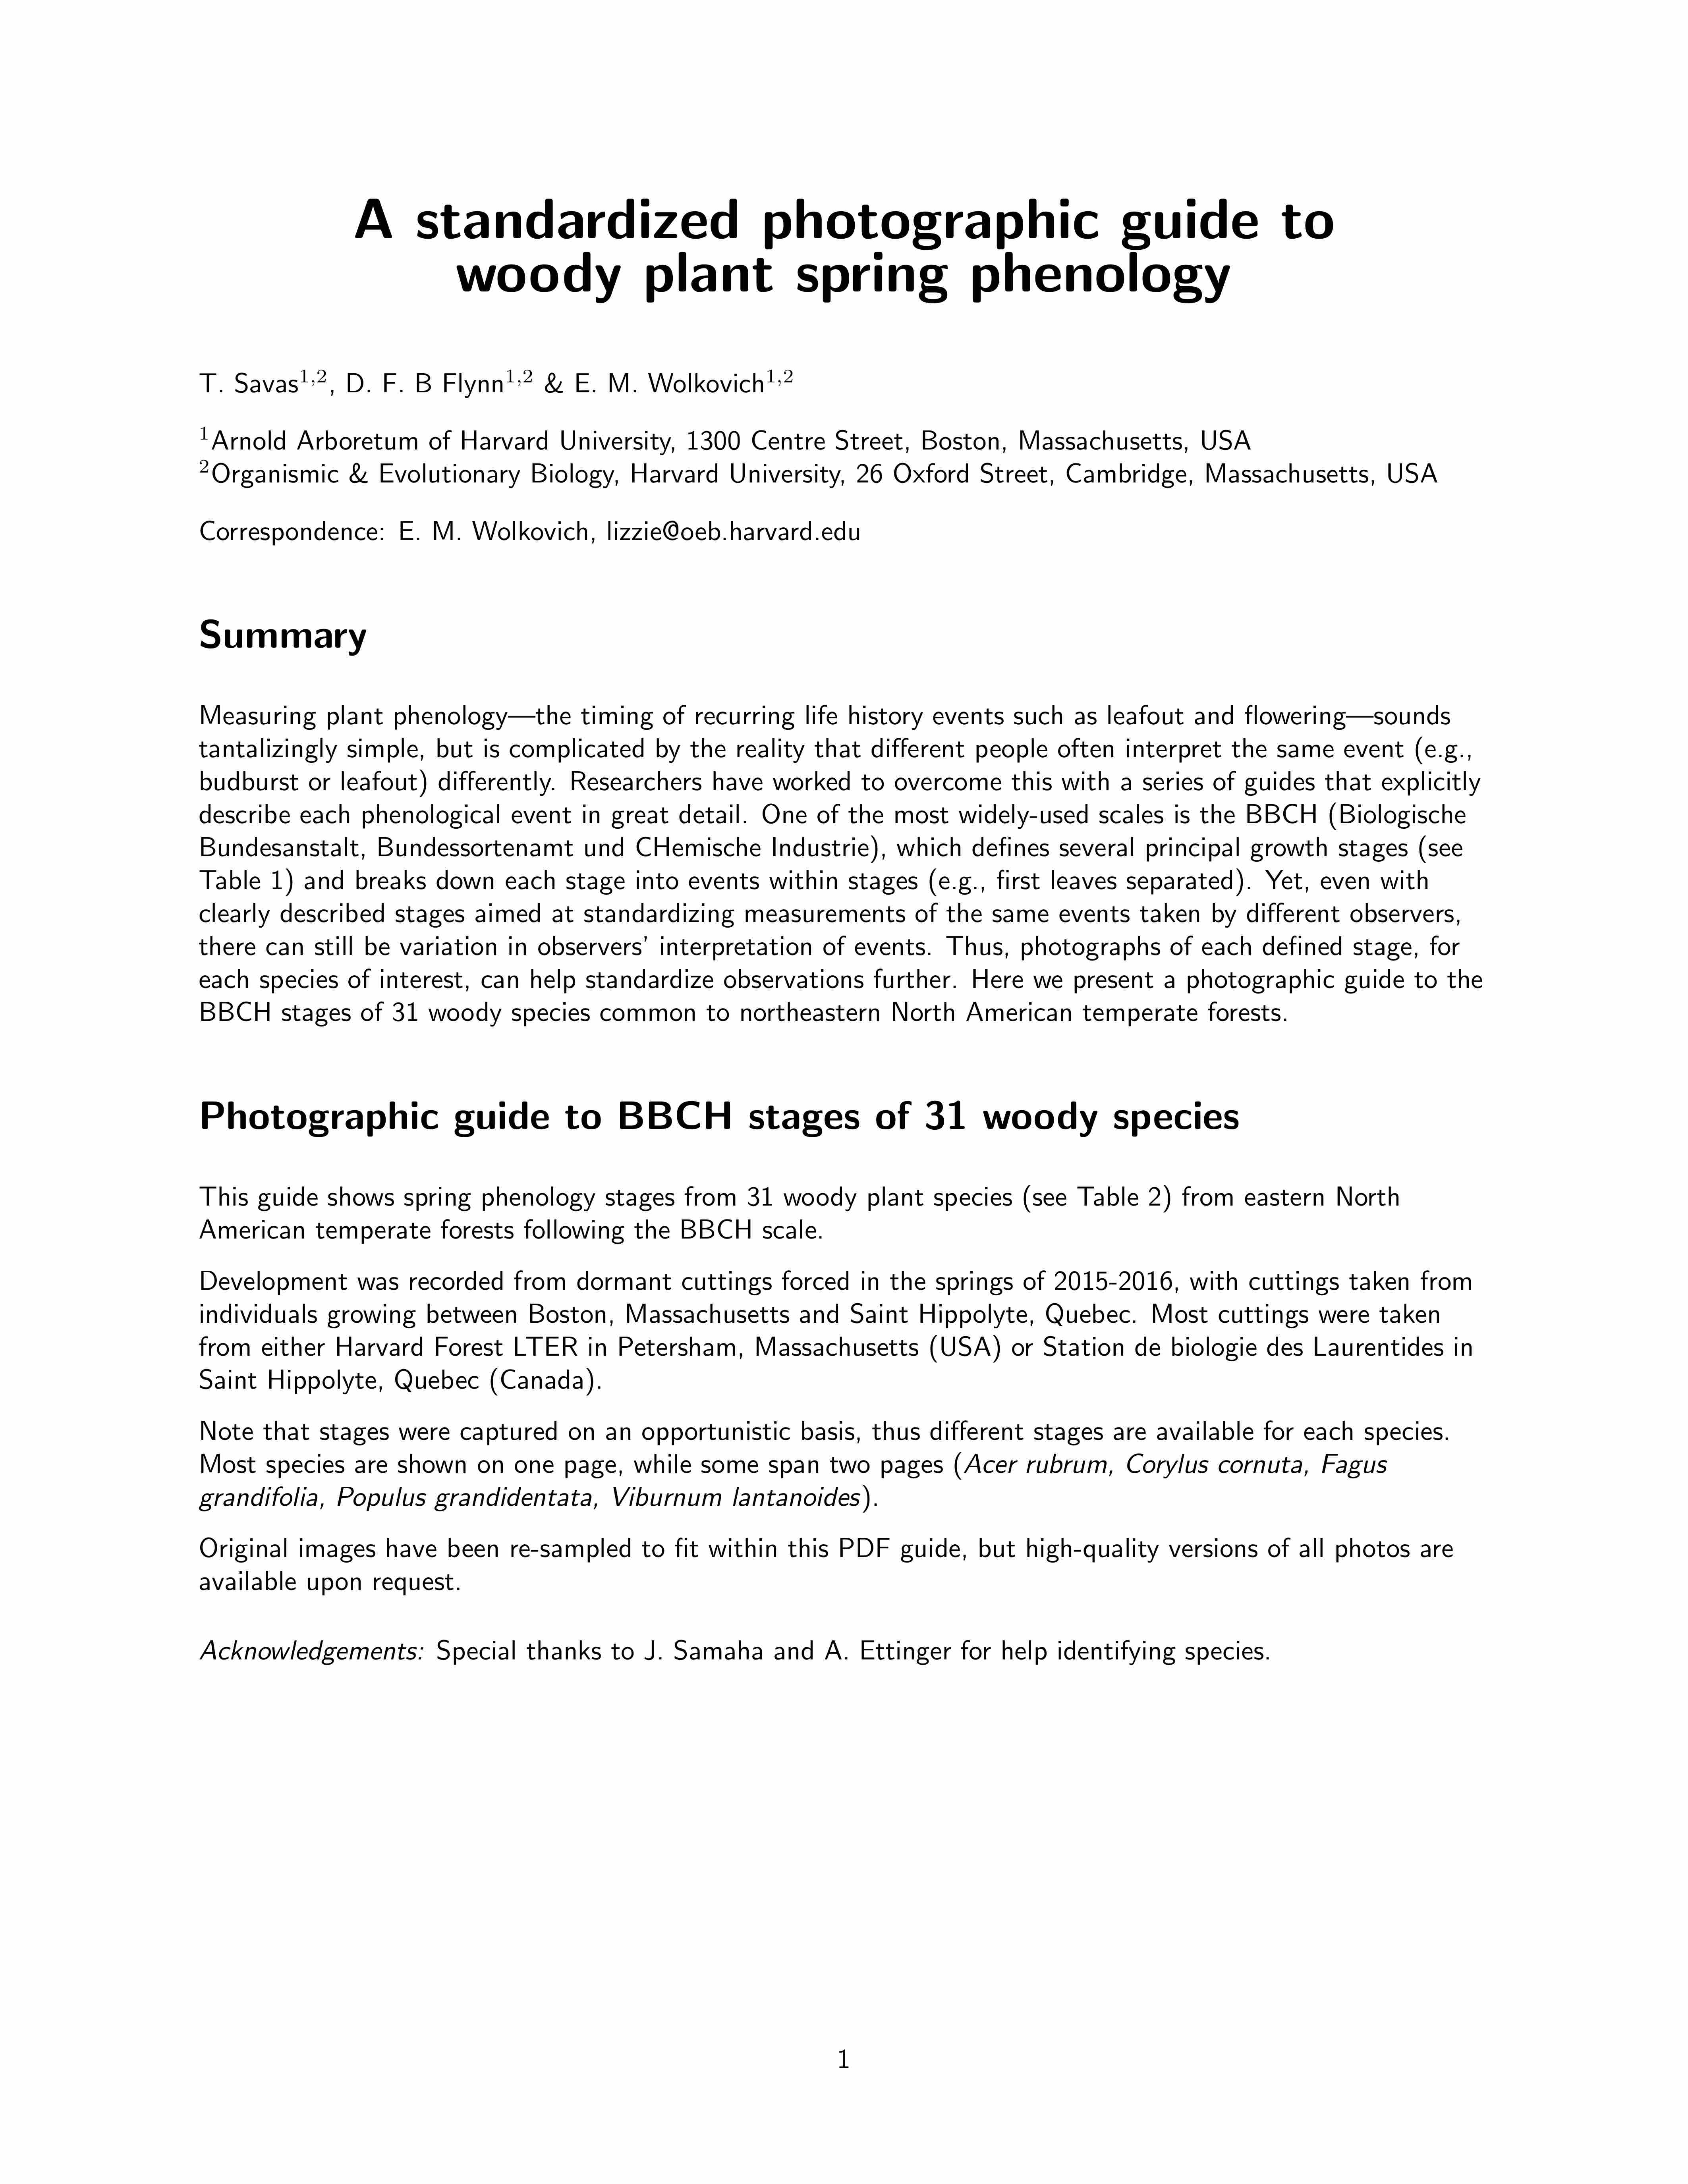
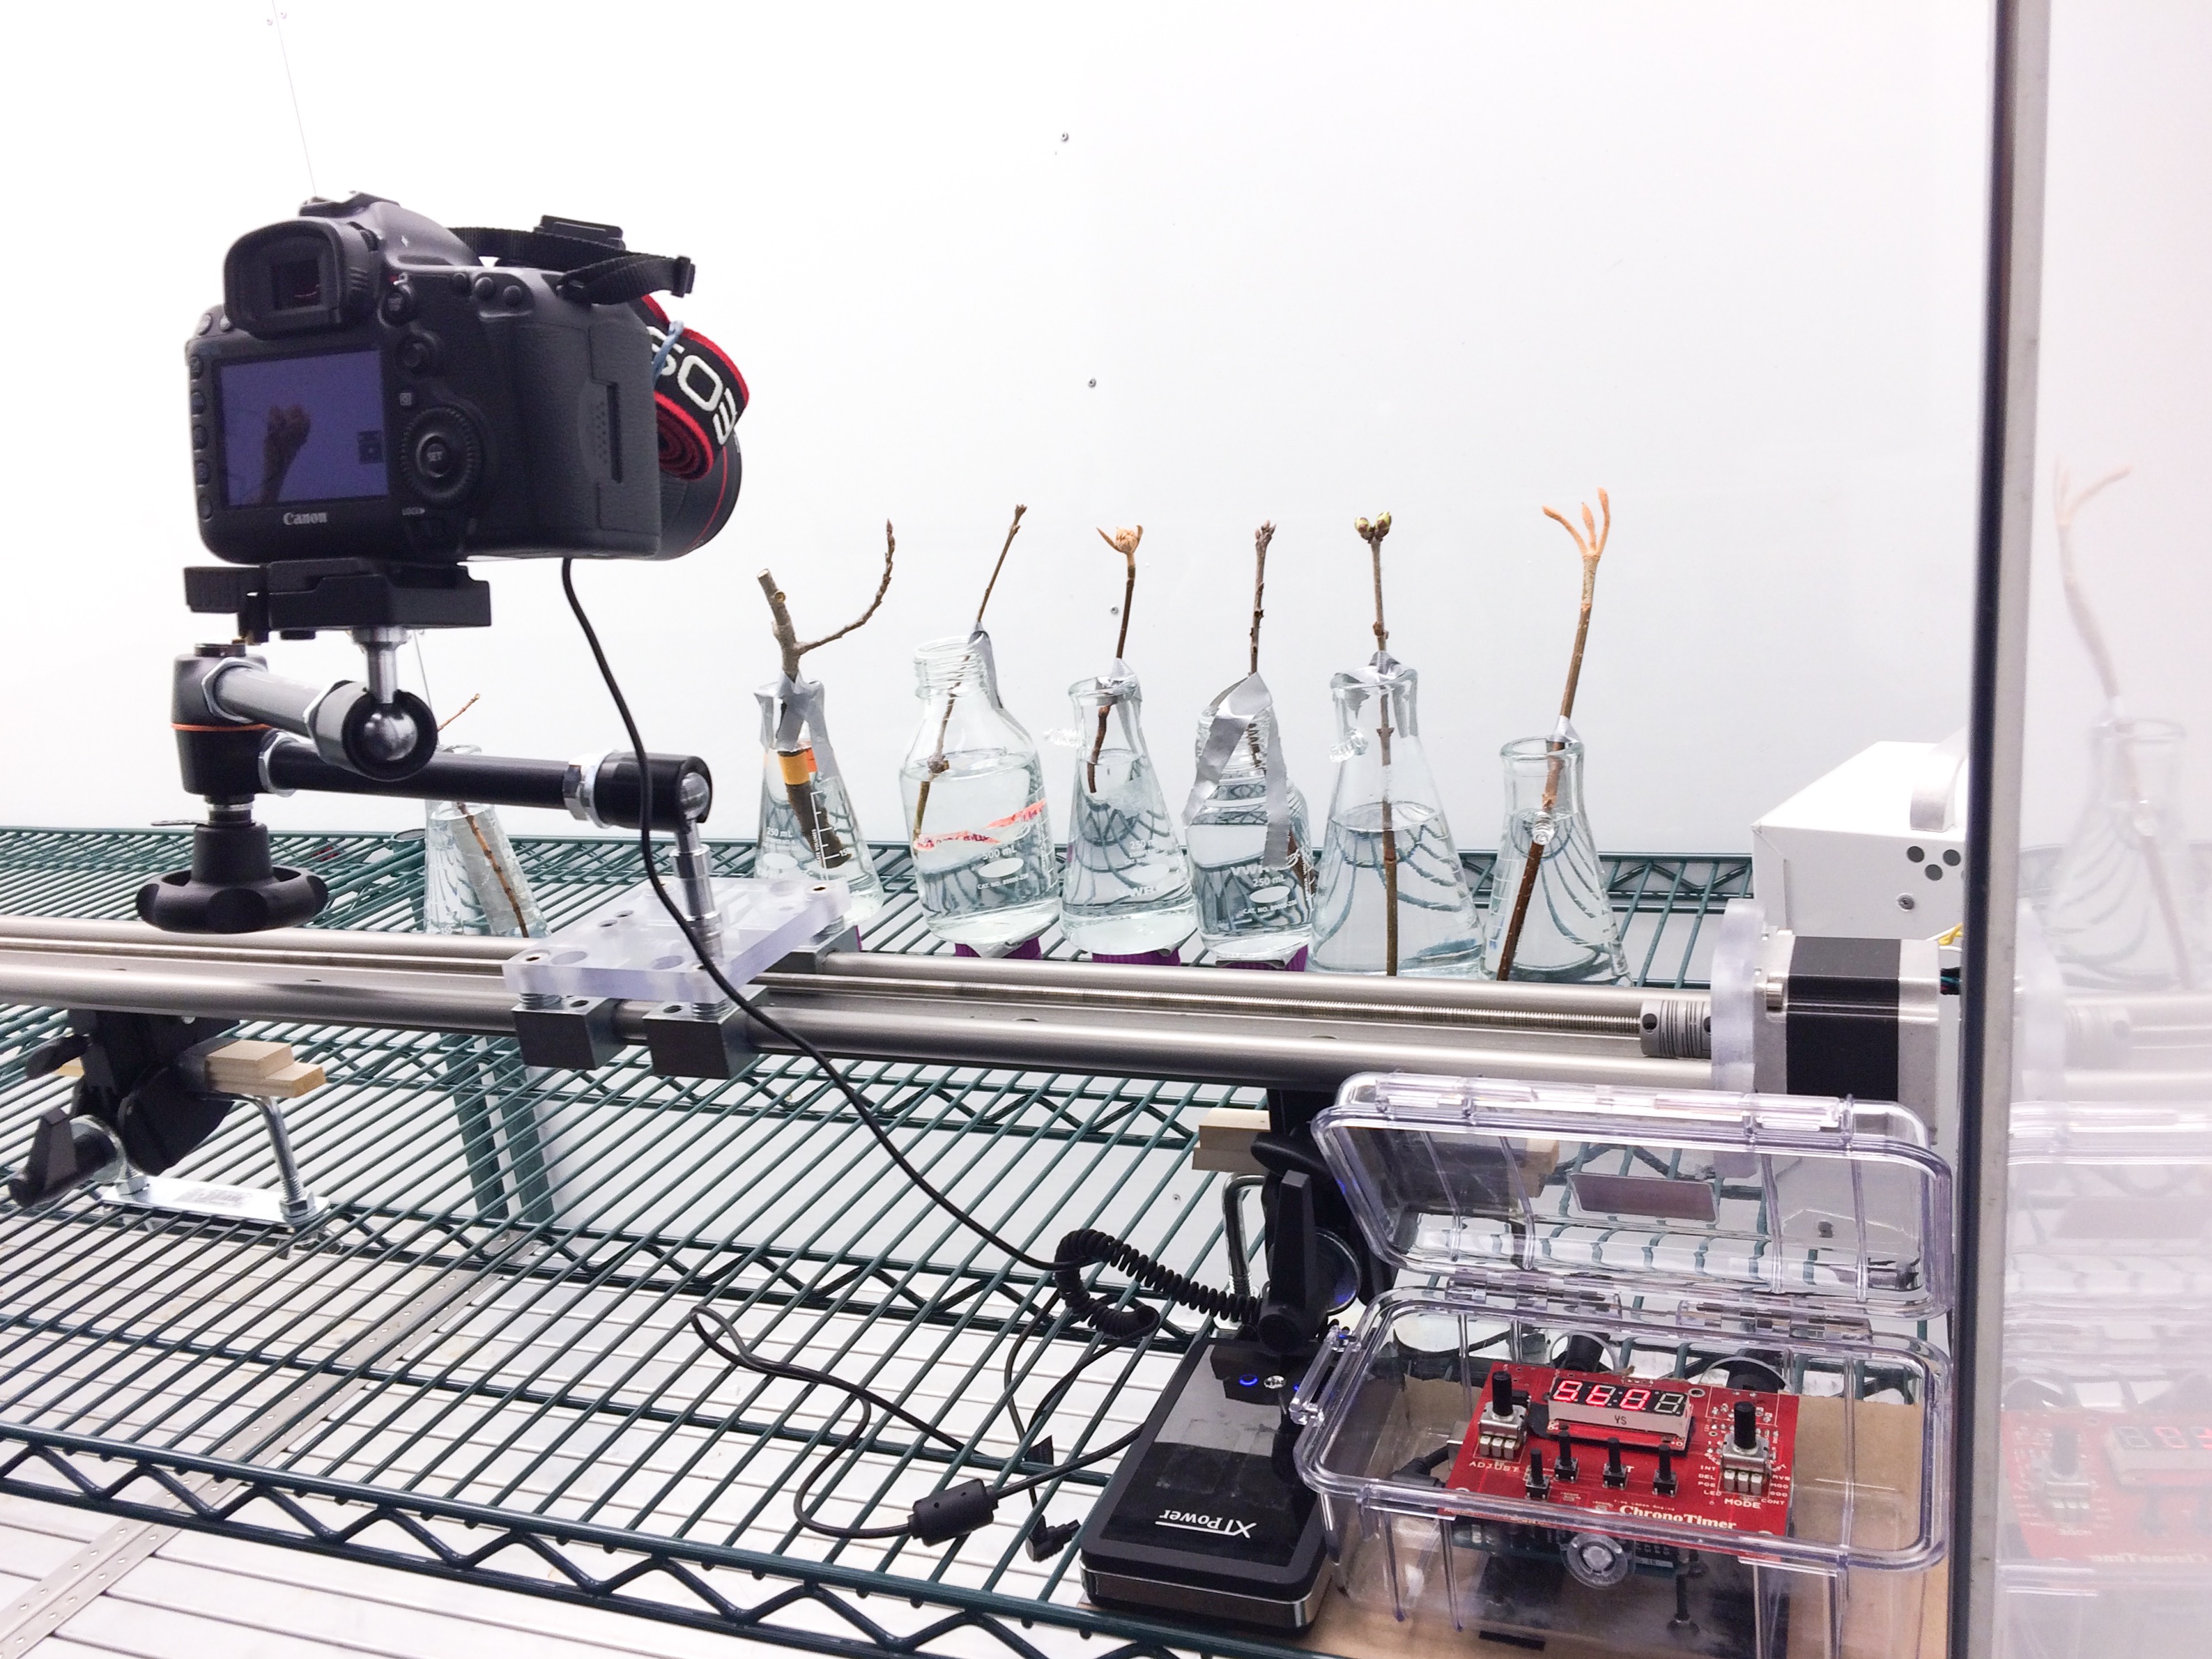
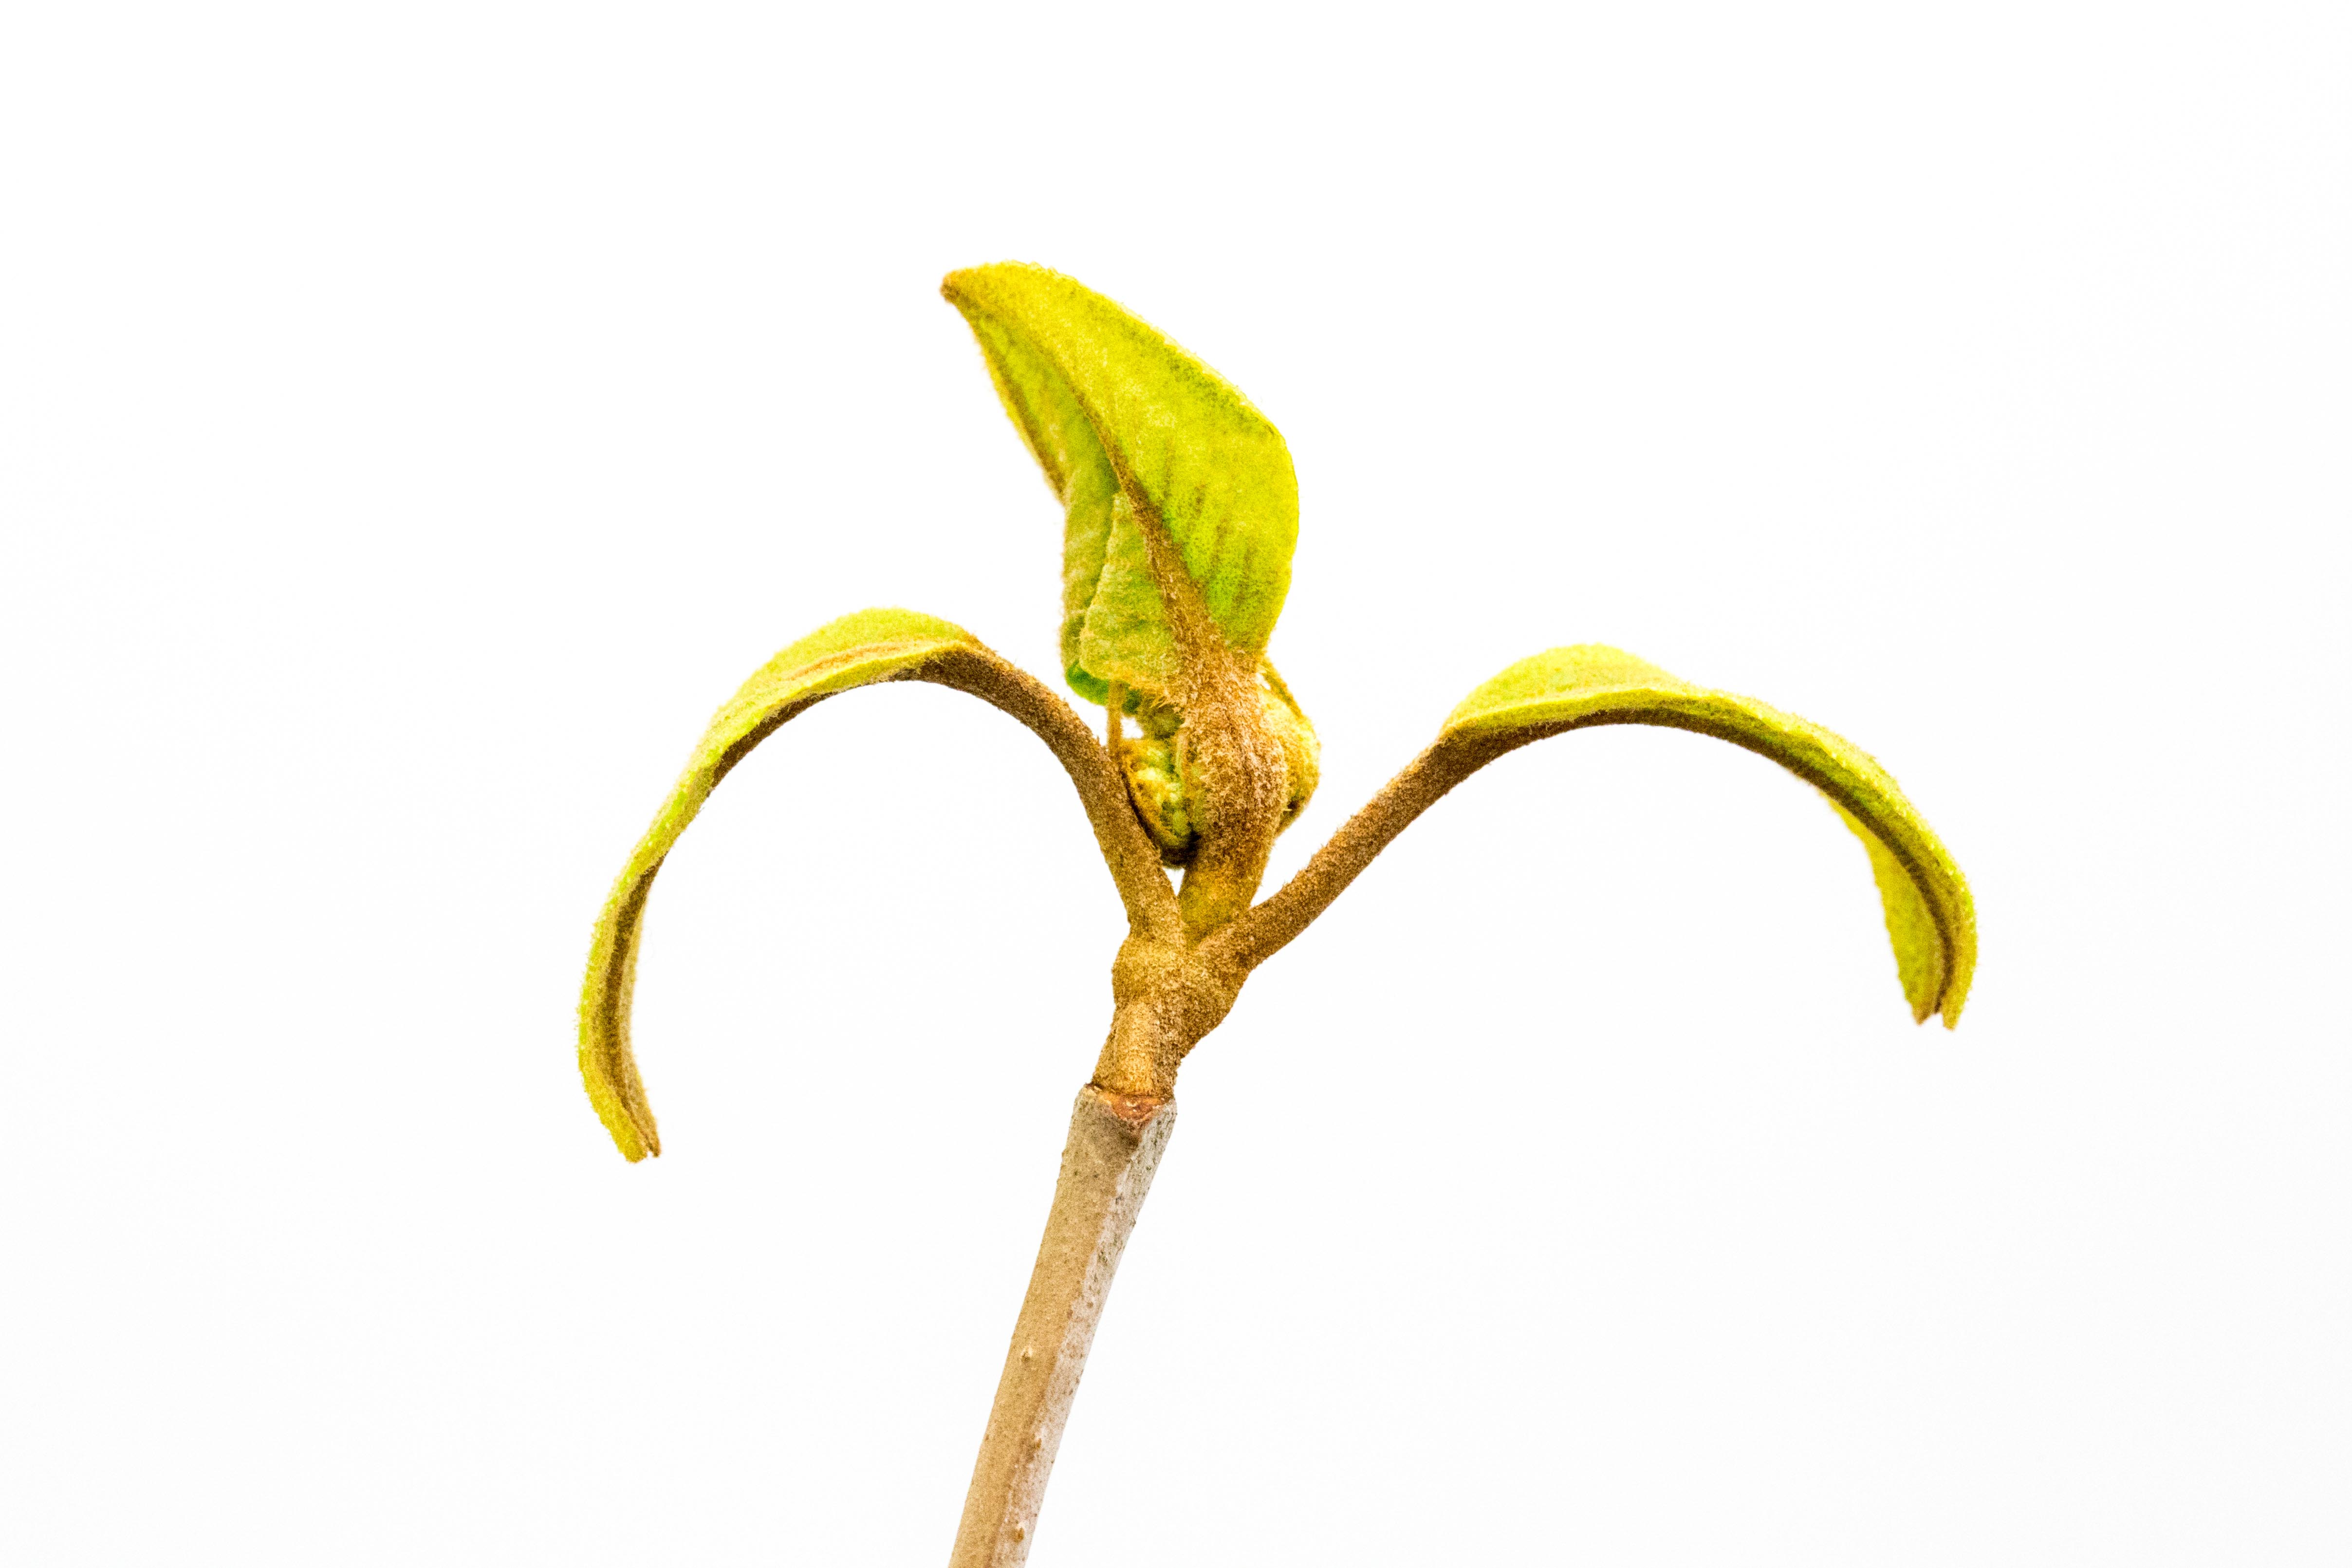
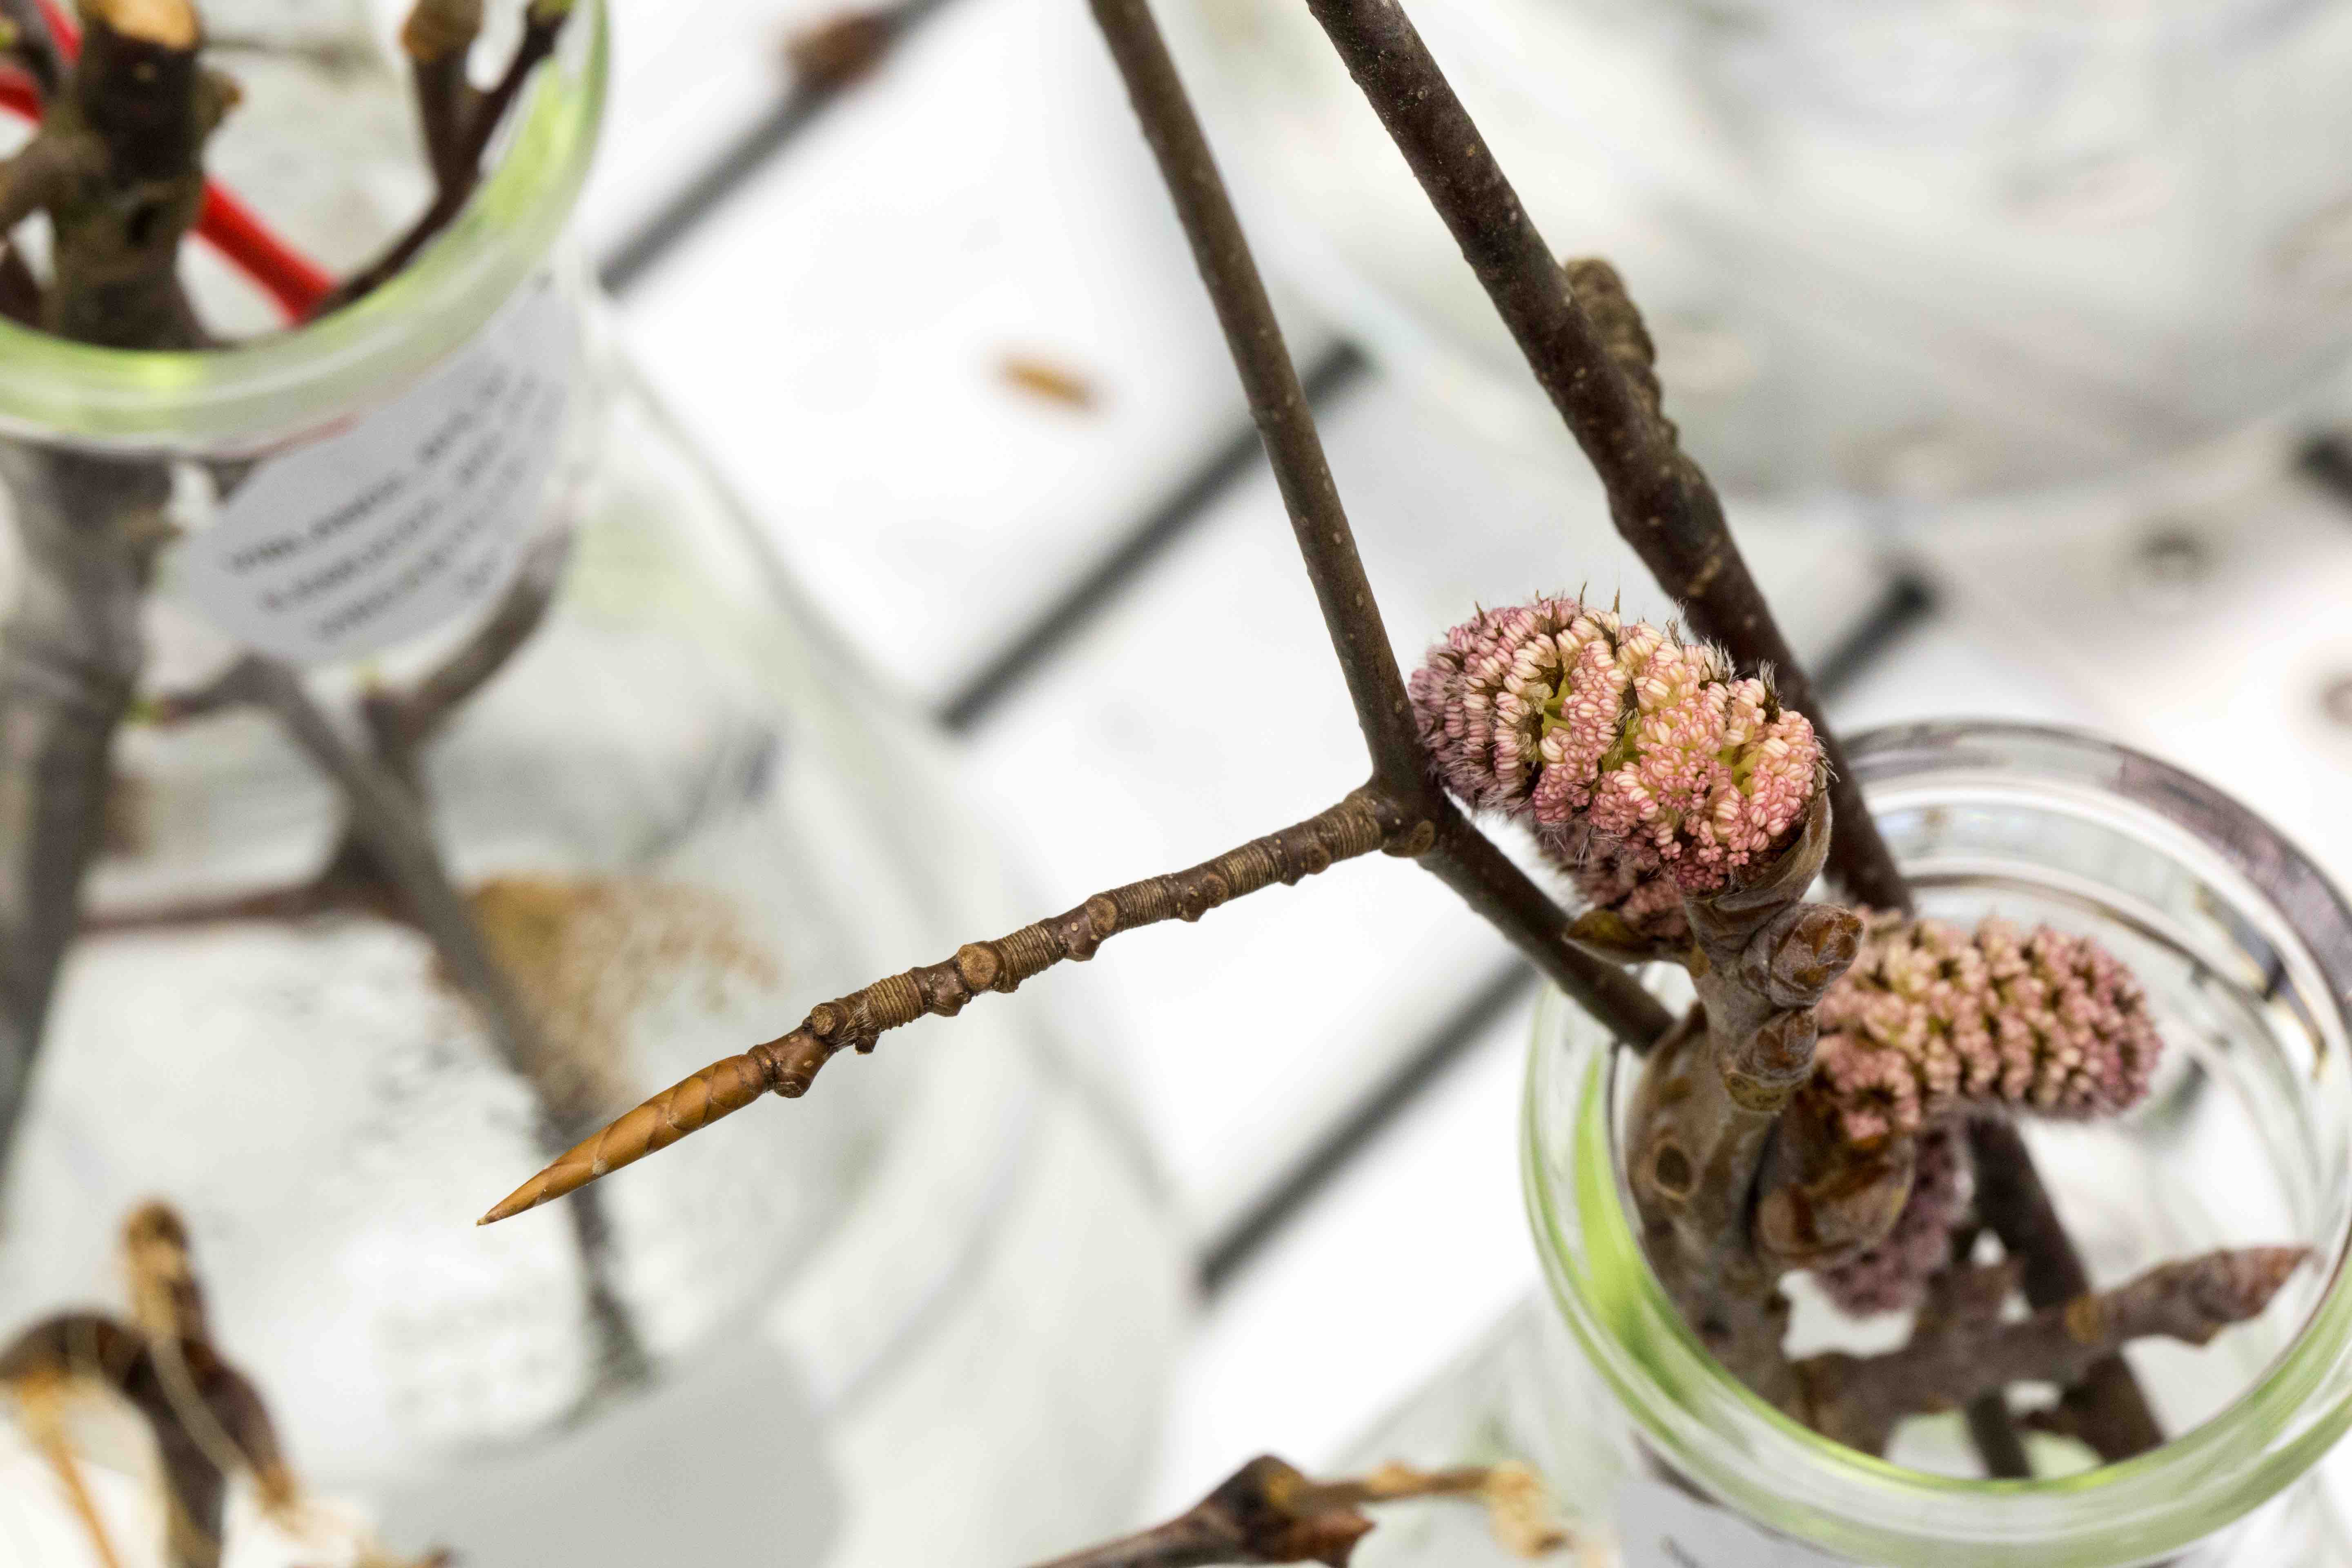
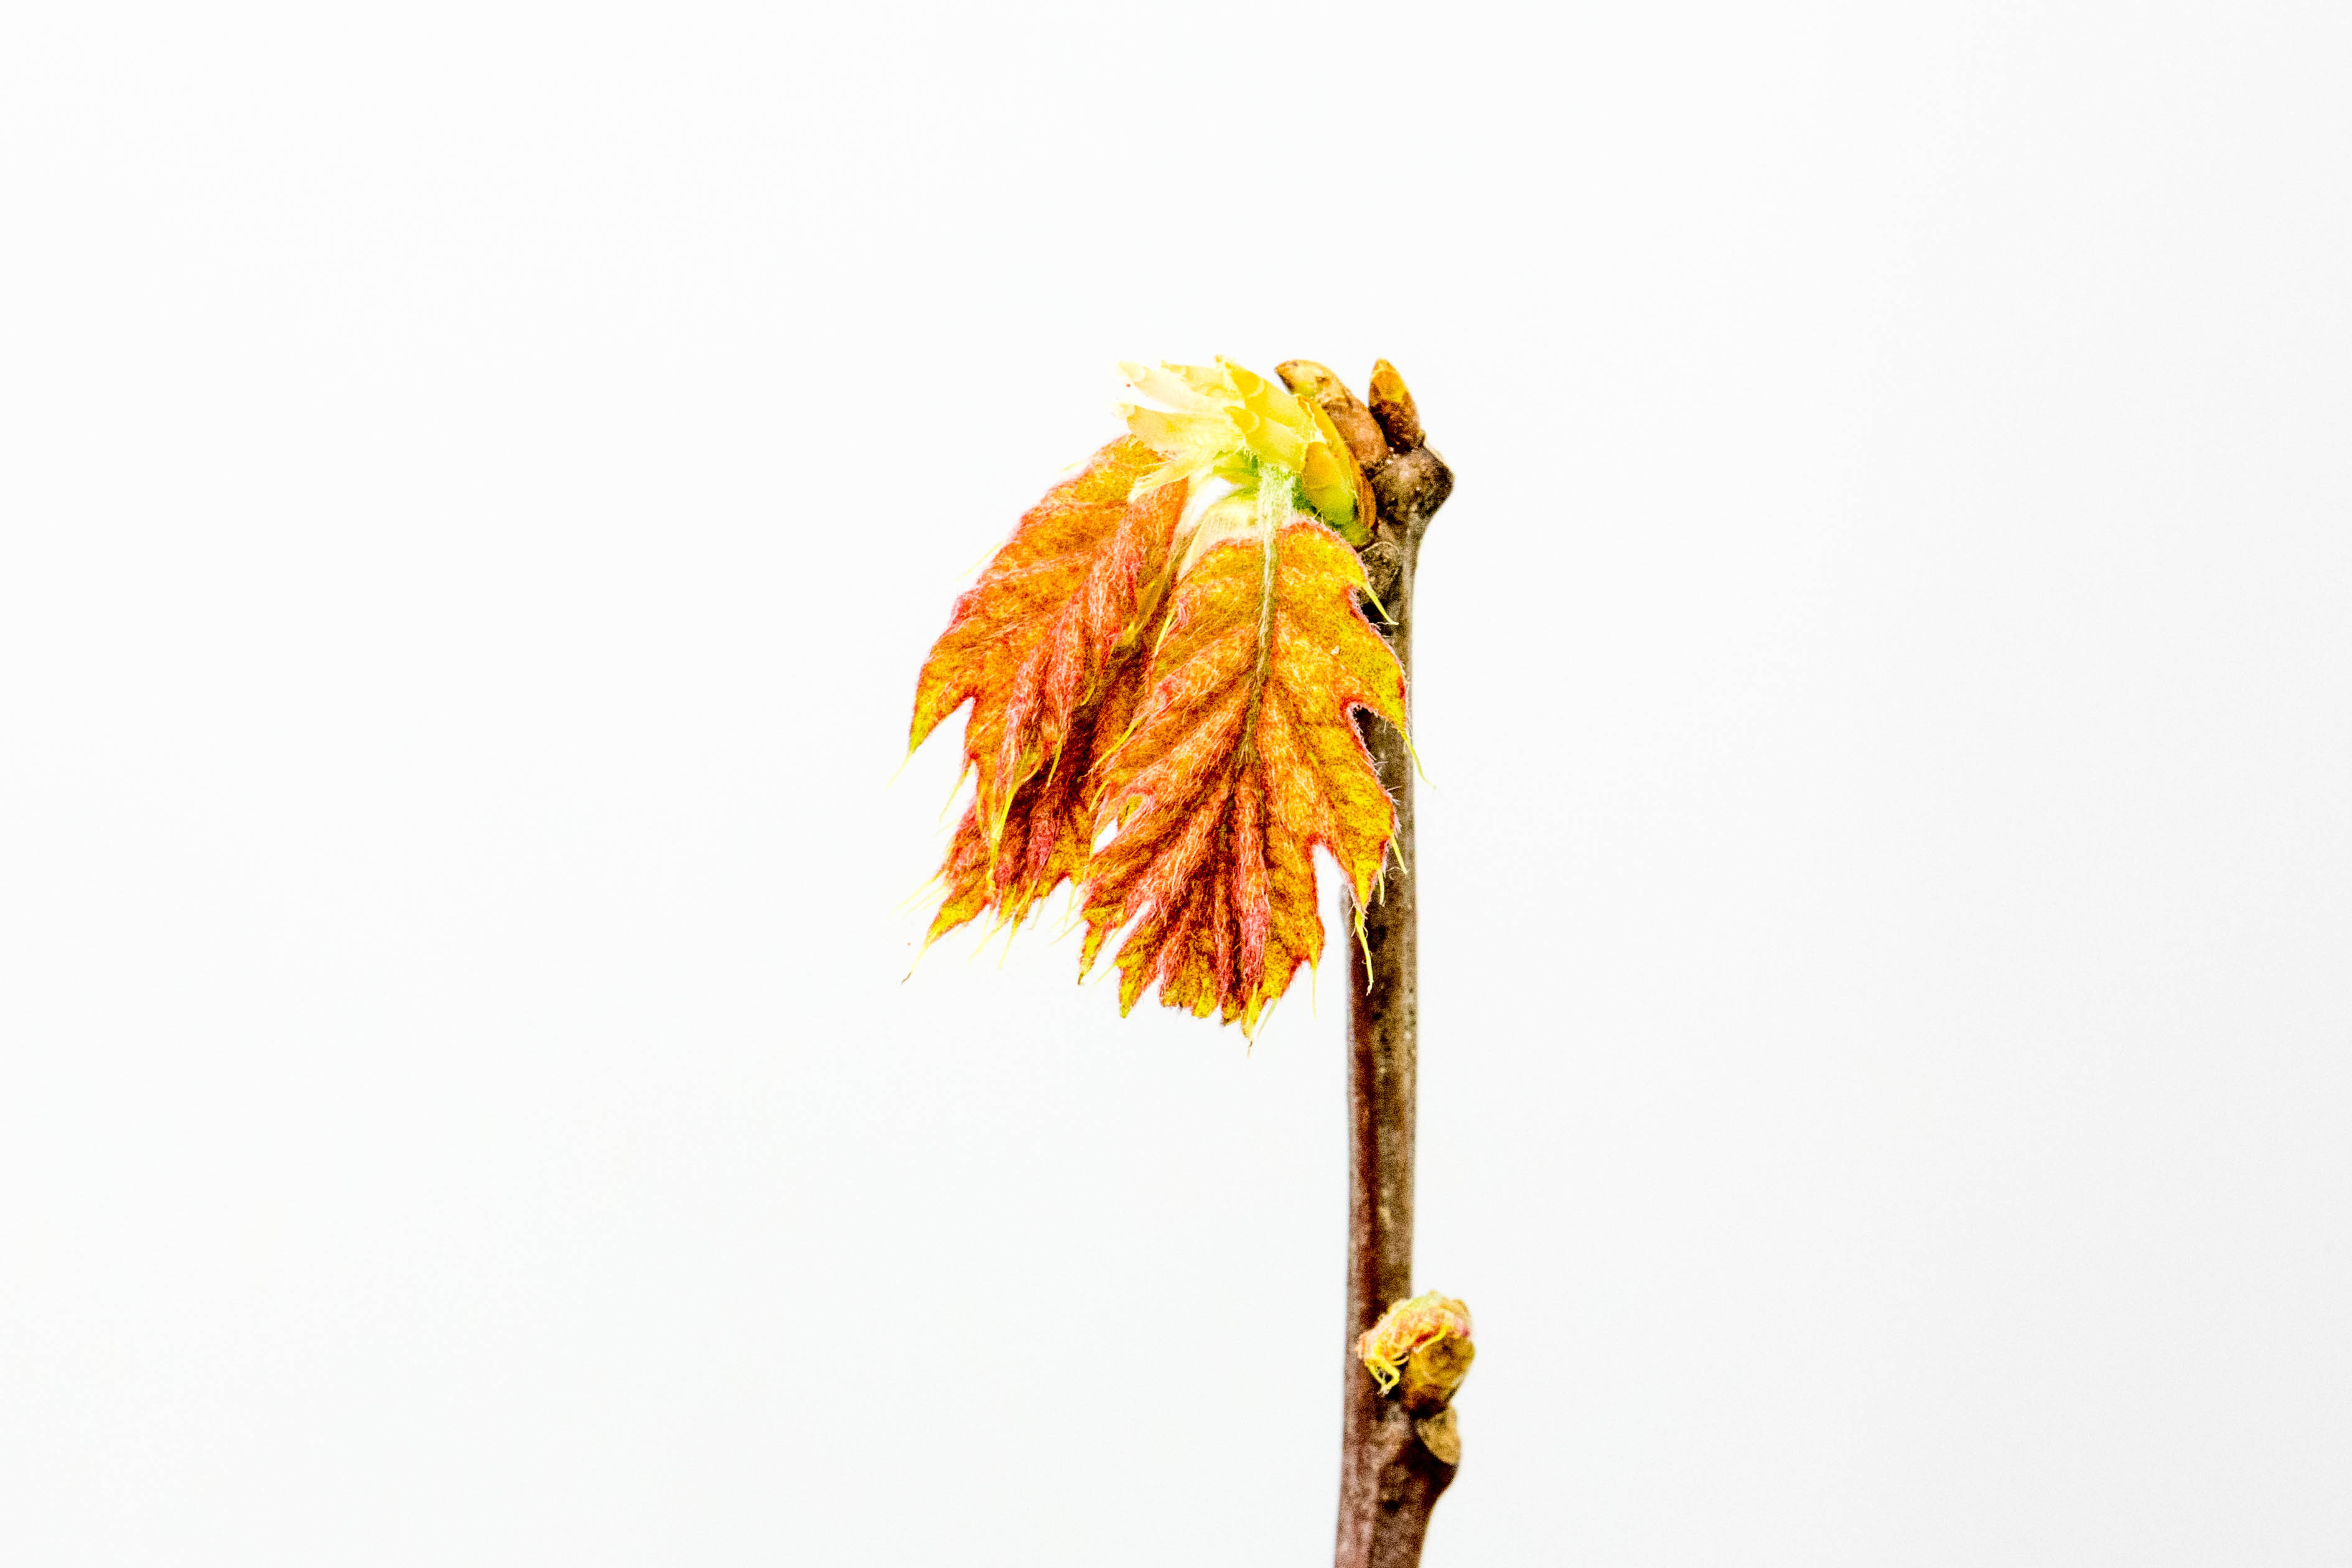
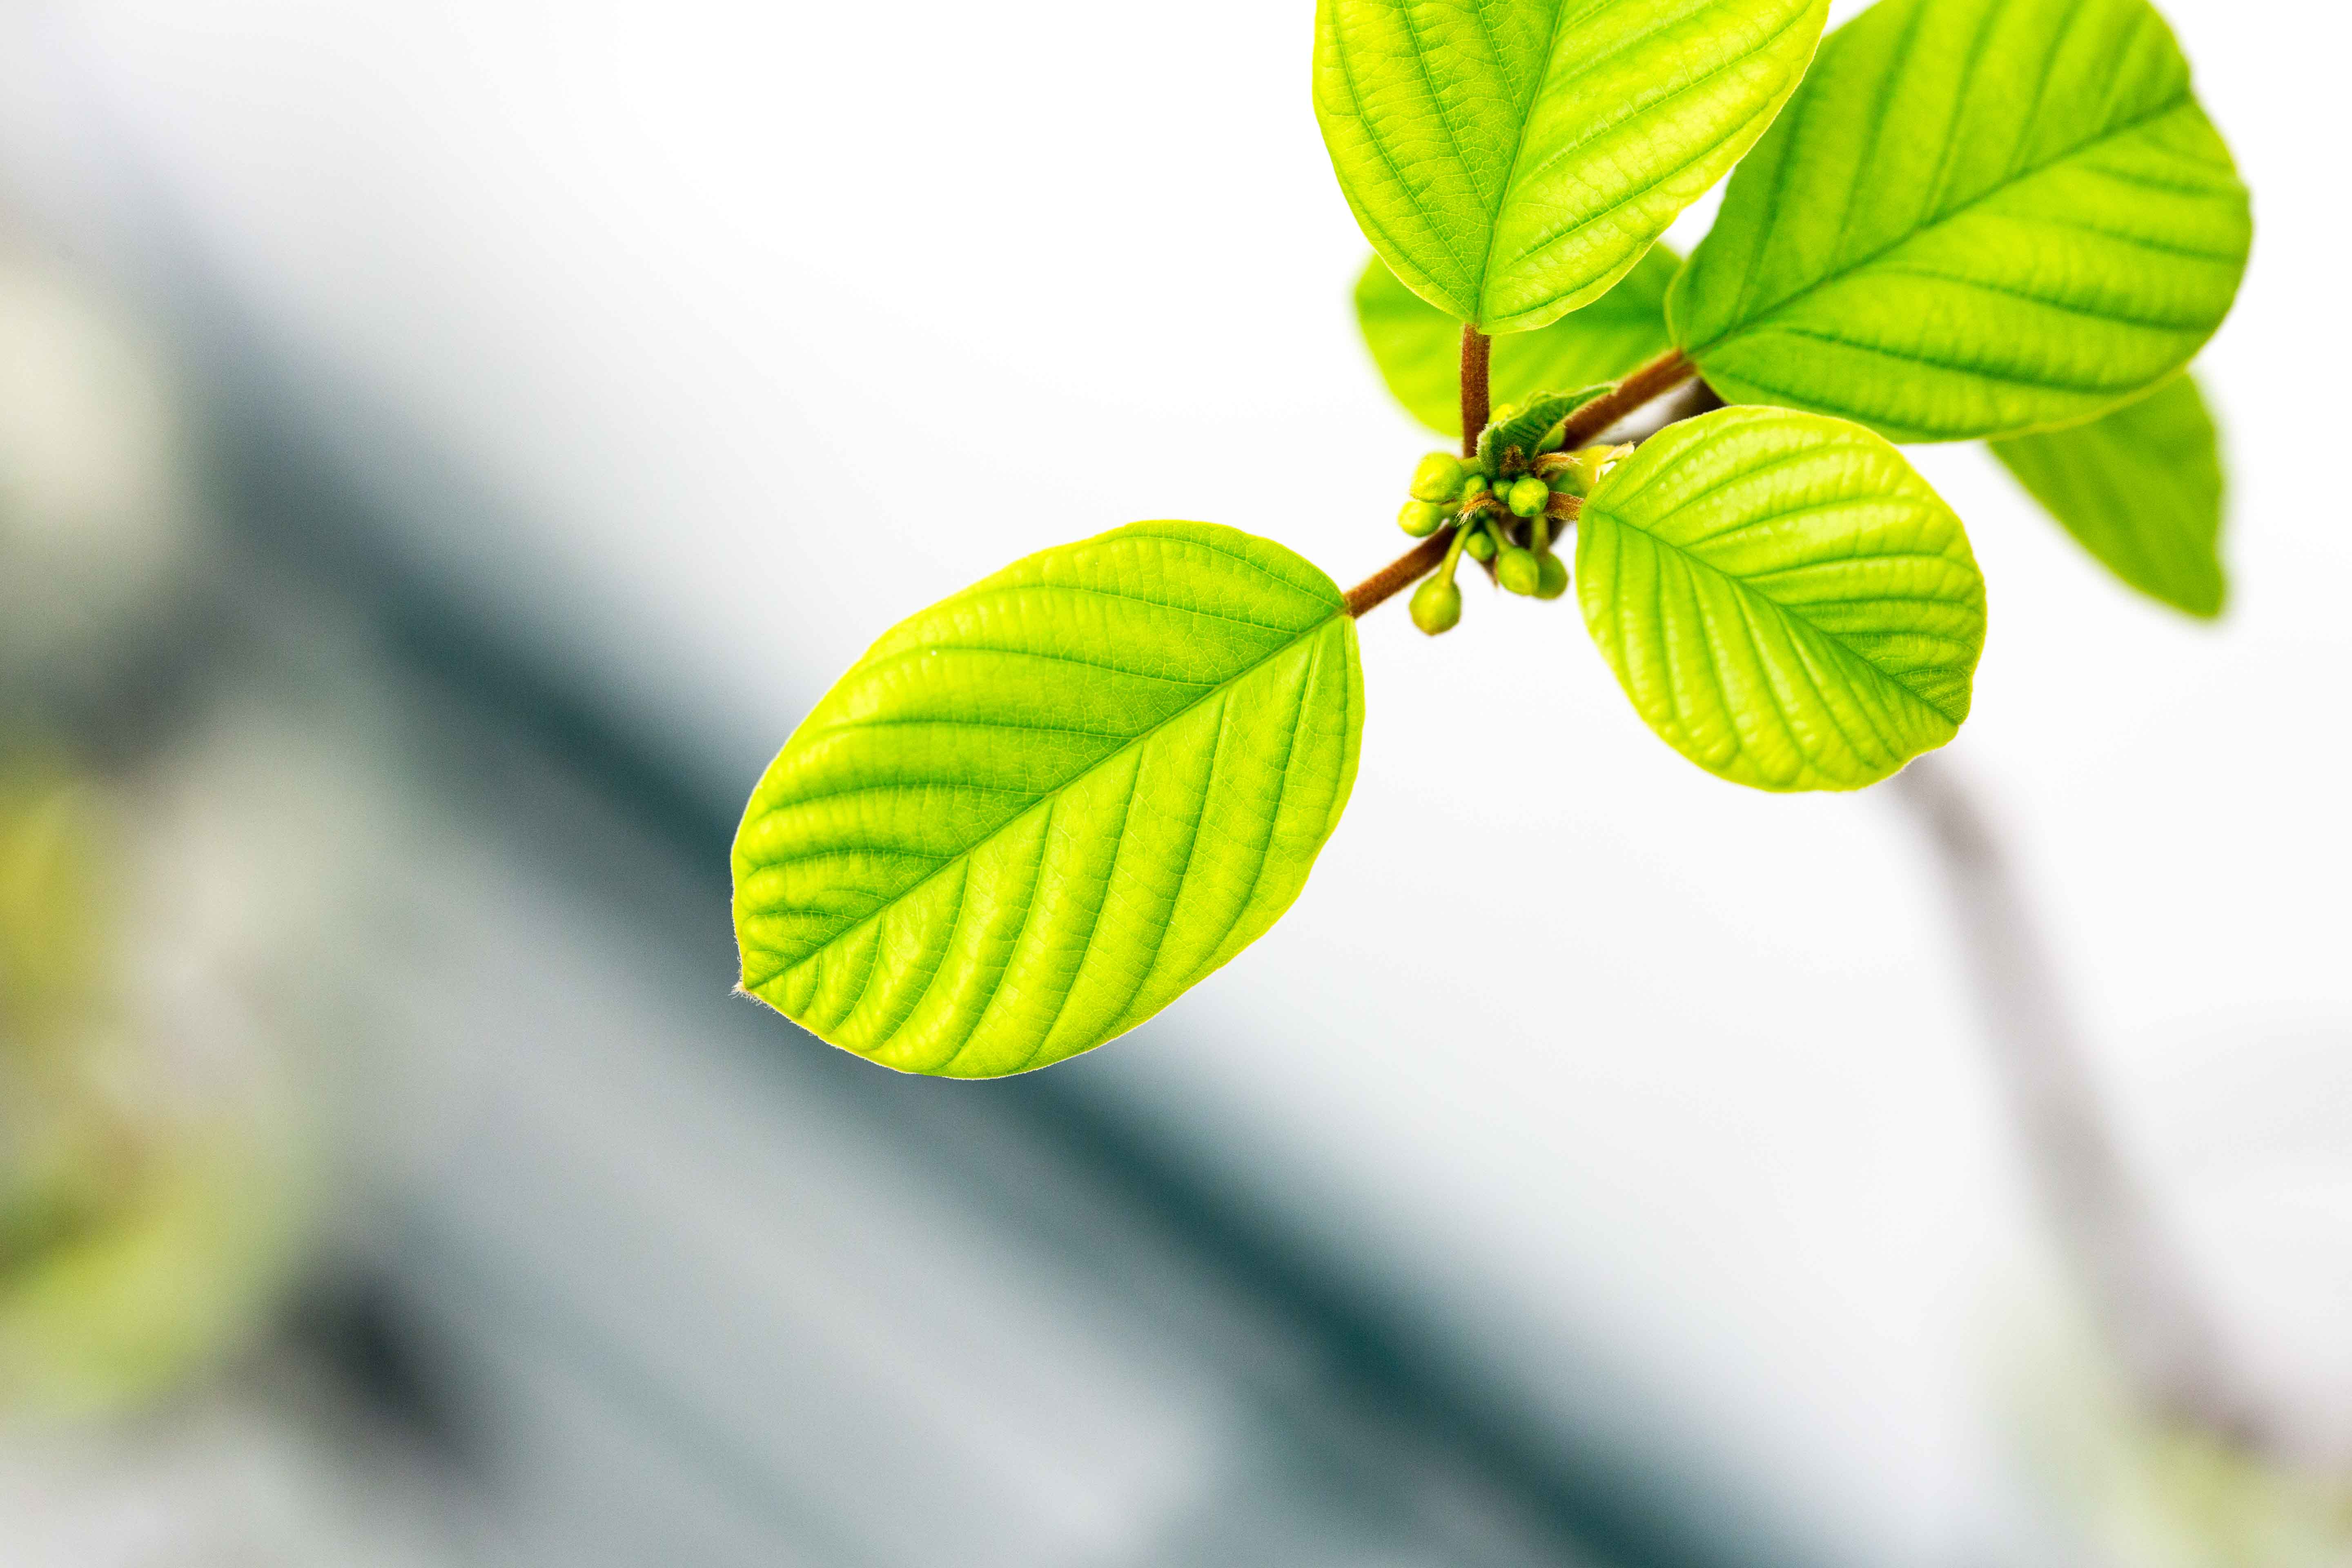
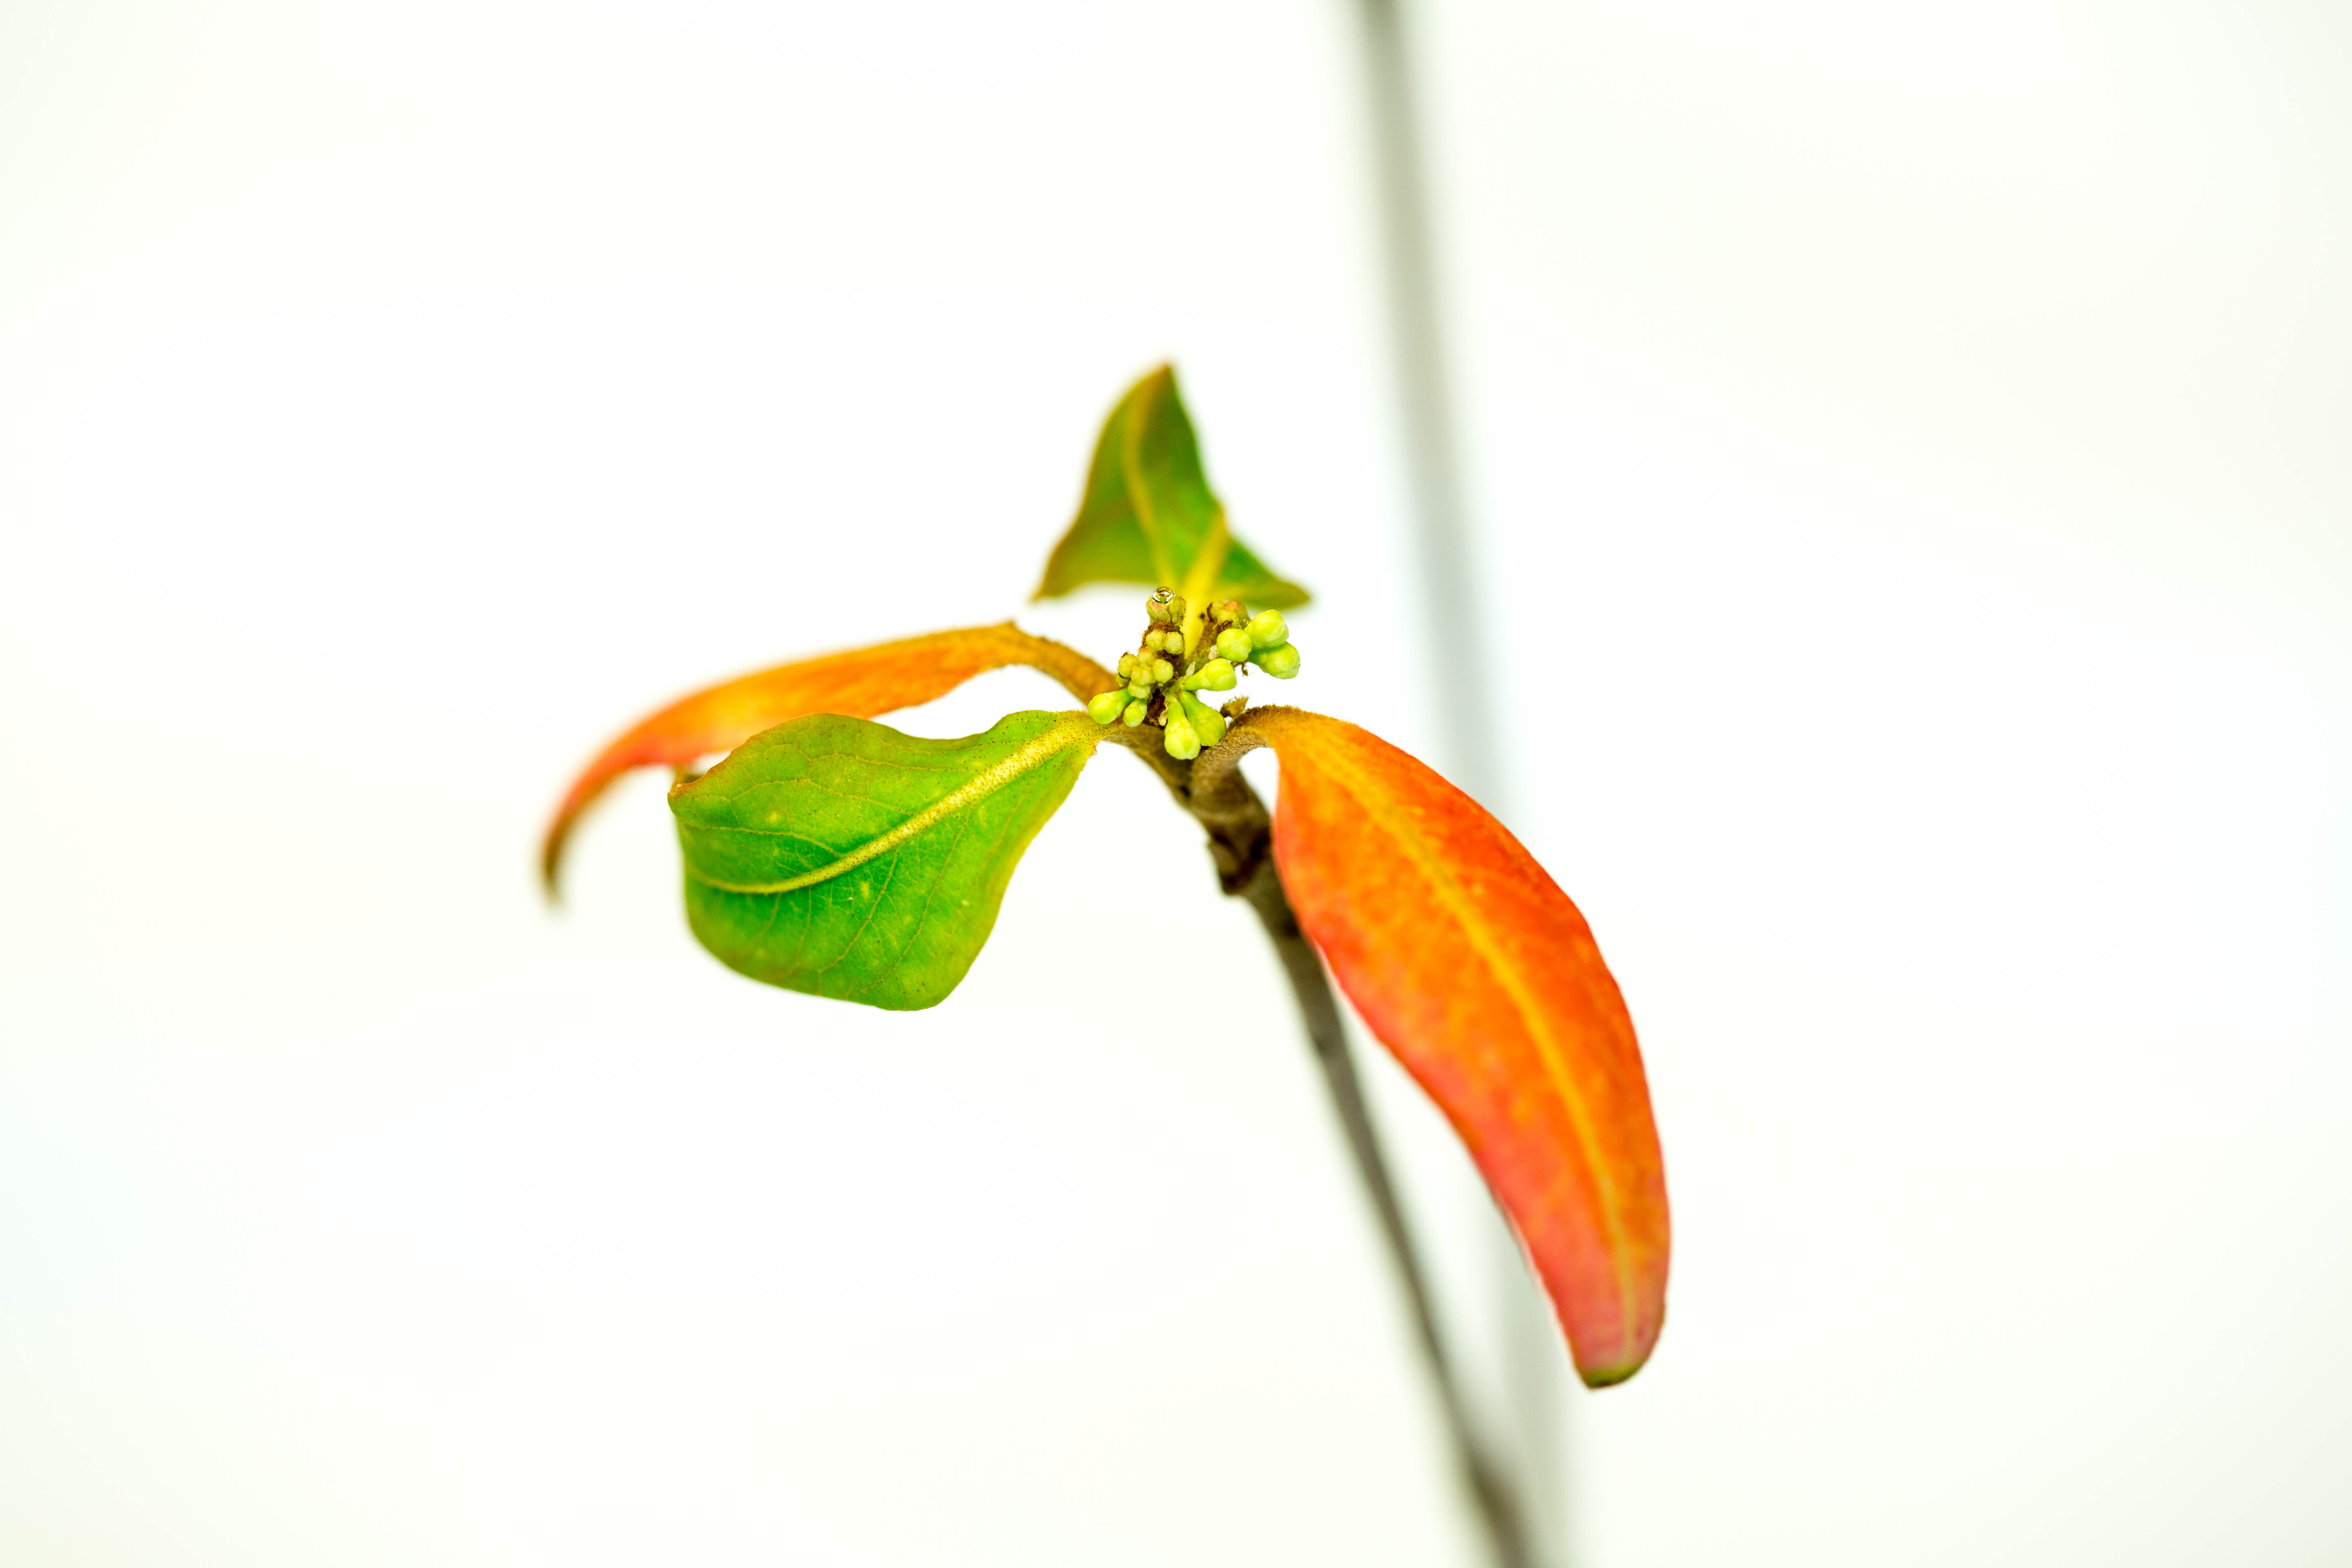
Pictured below, image samples of the guide and their according growth stages.
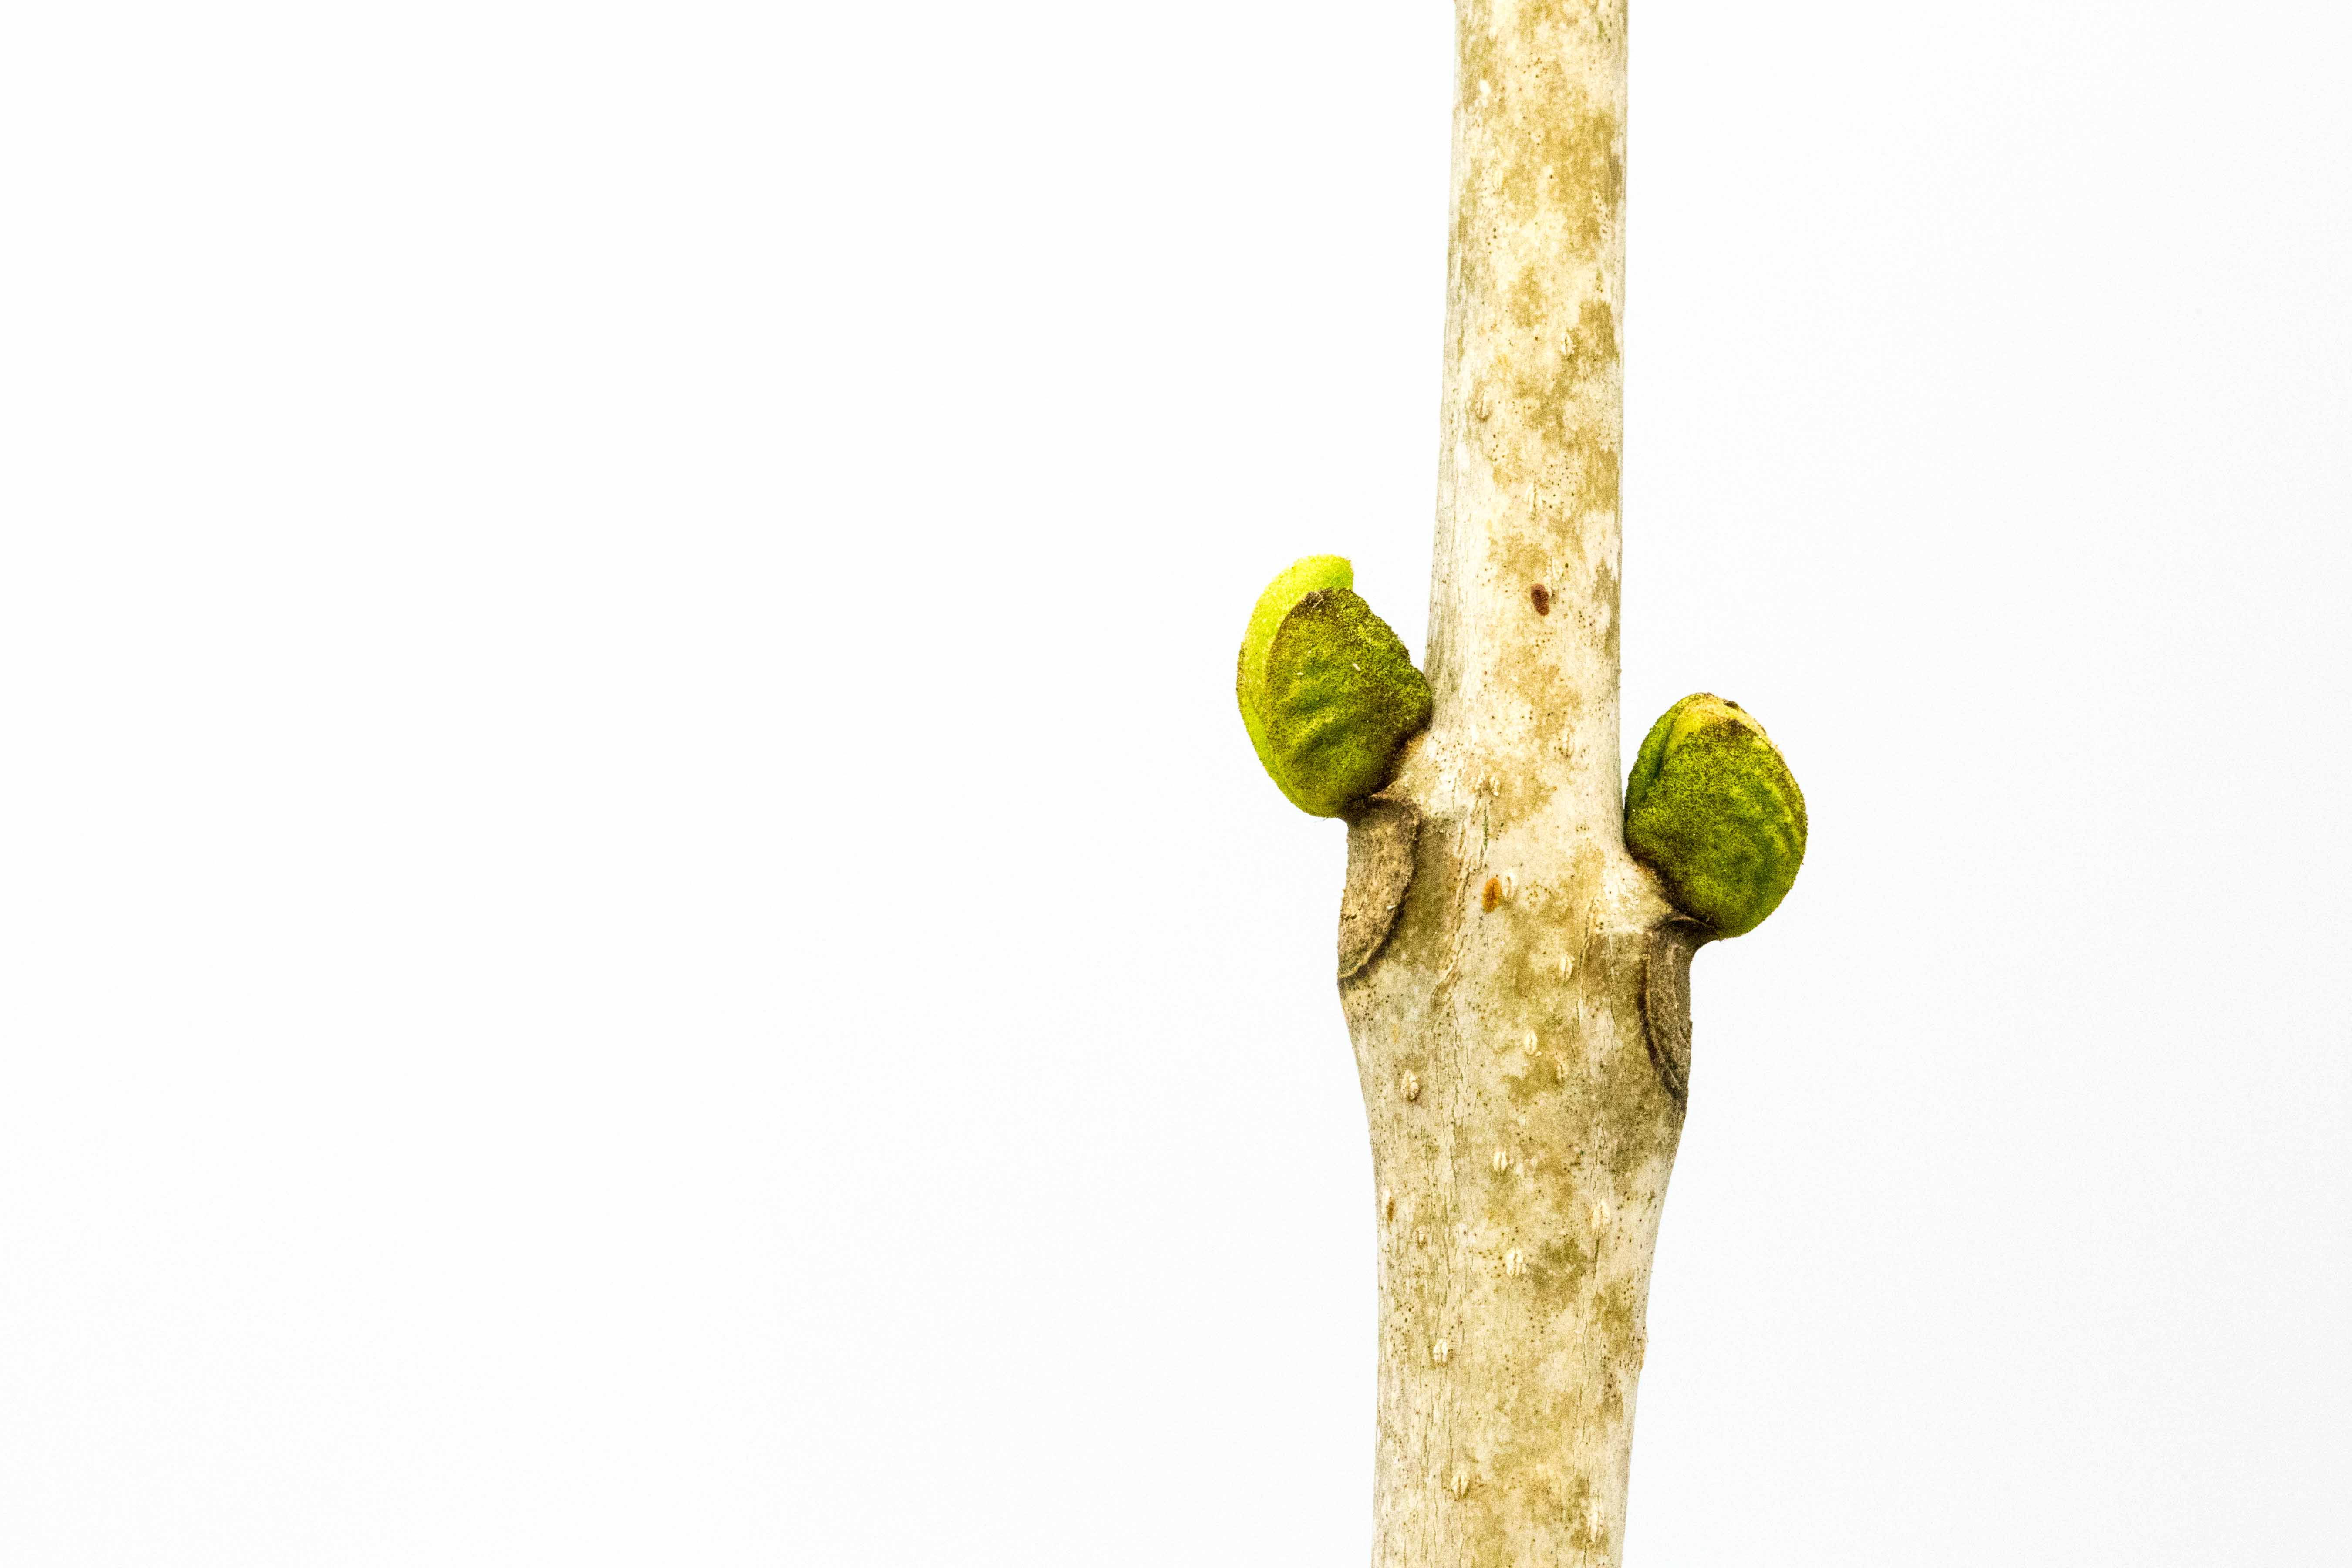
Fraxinus nigra stage 01
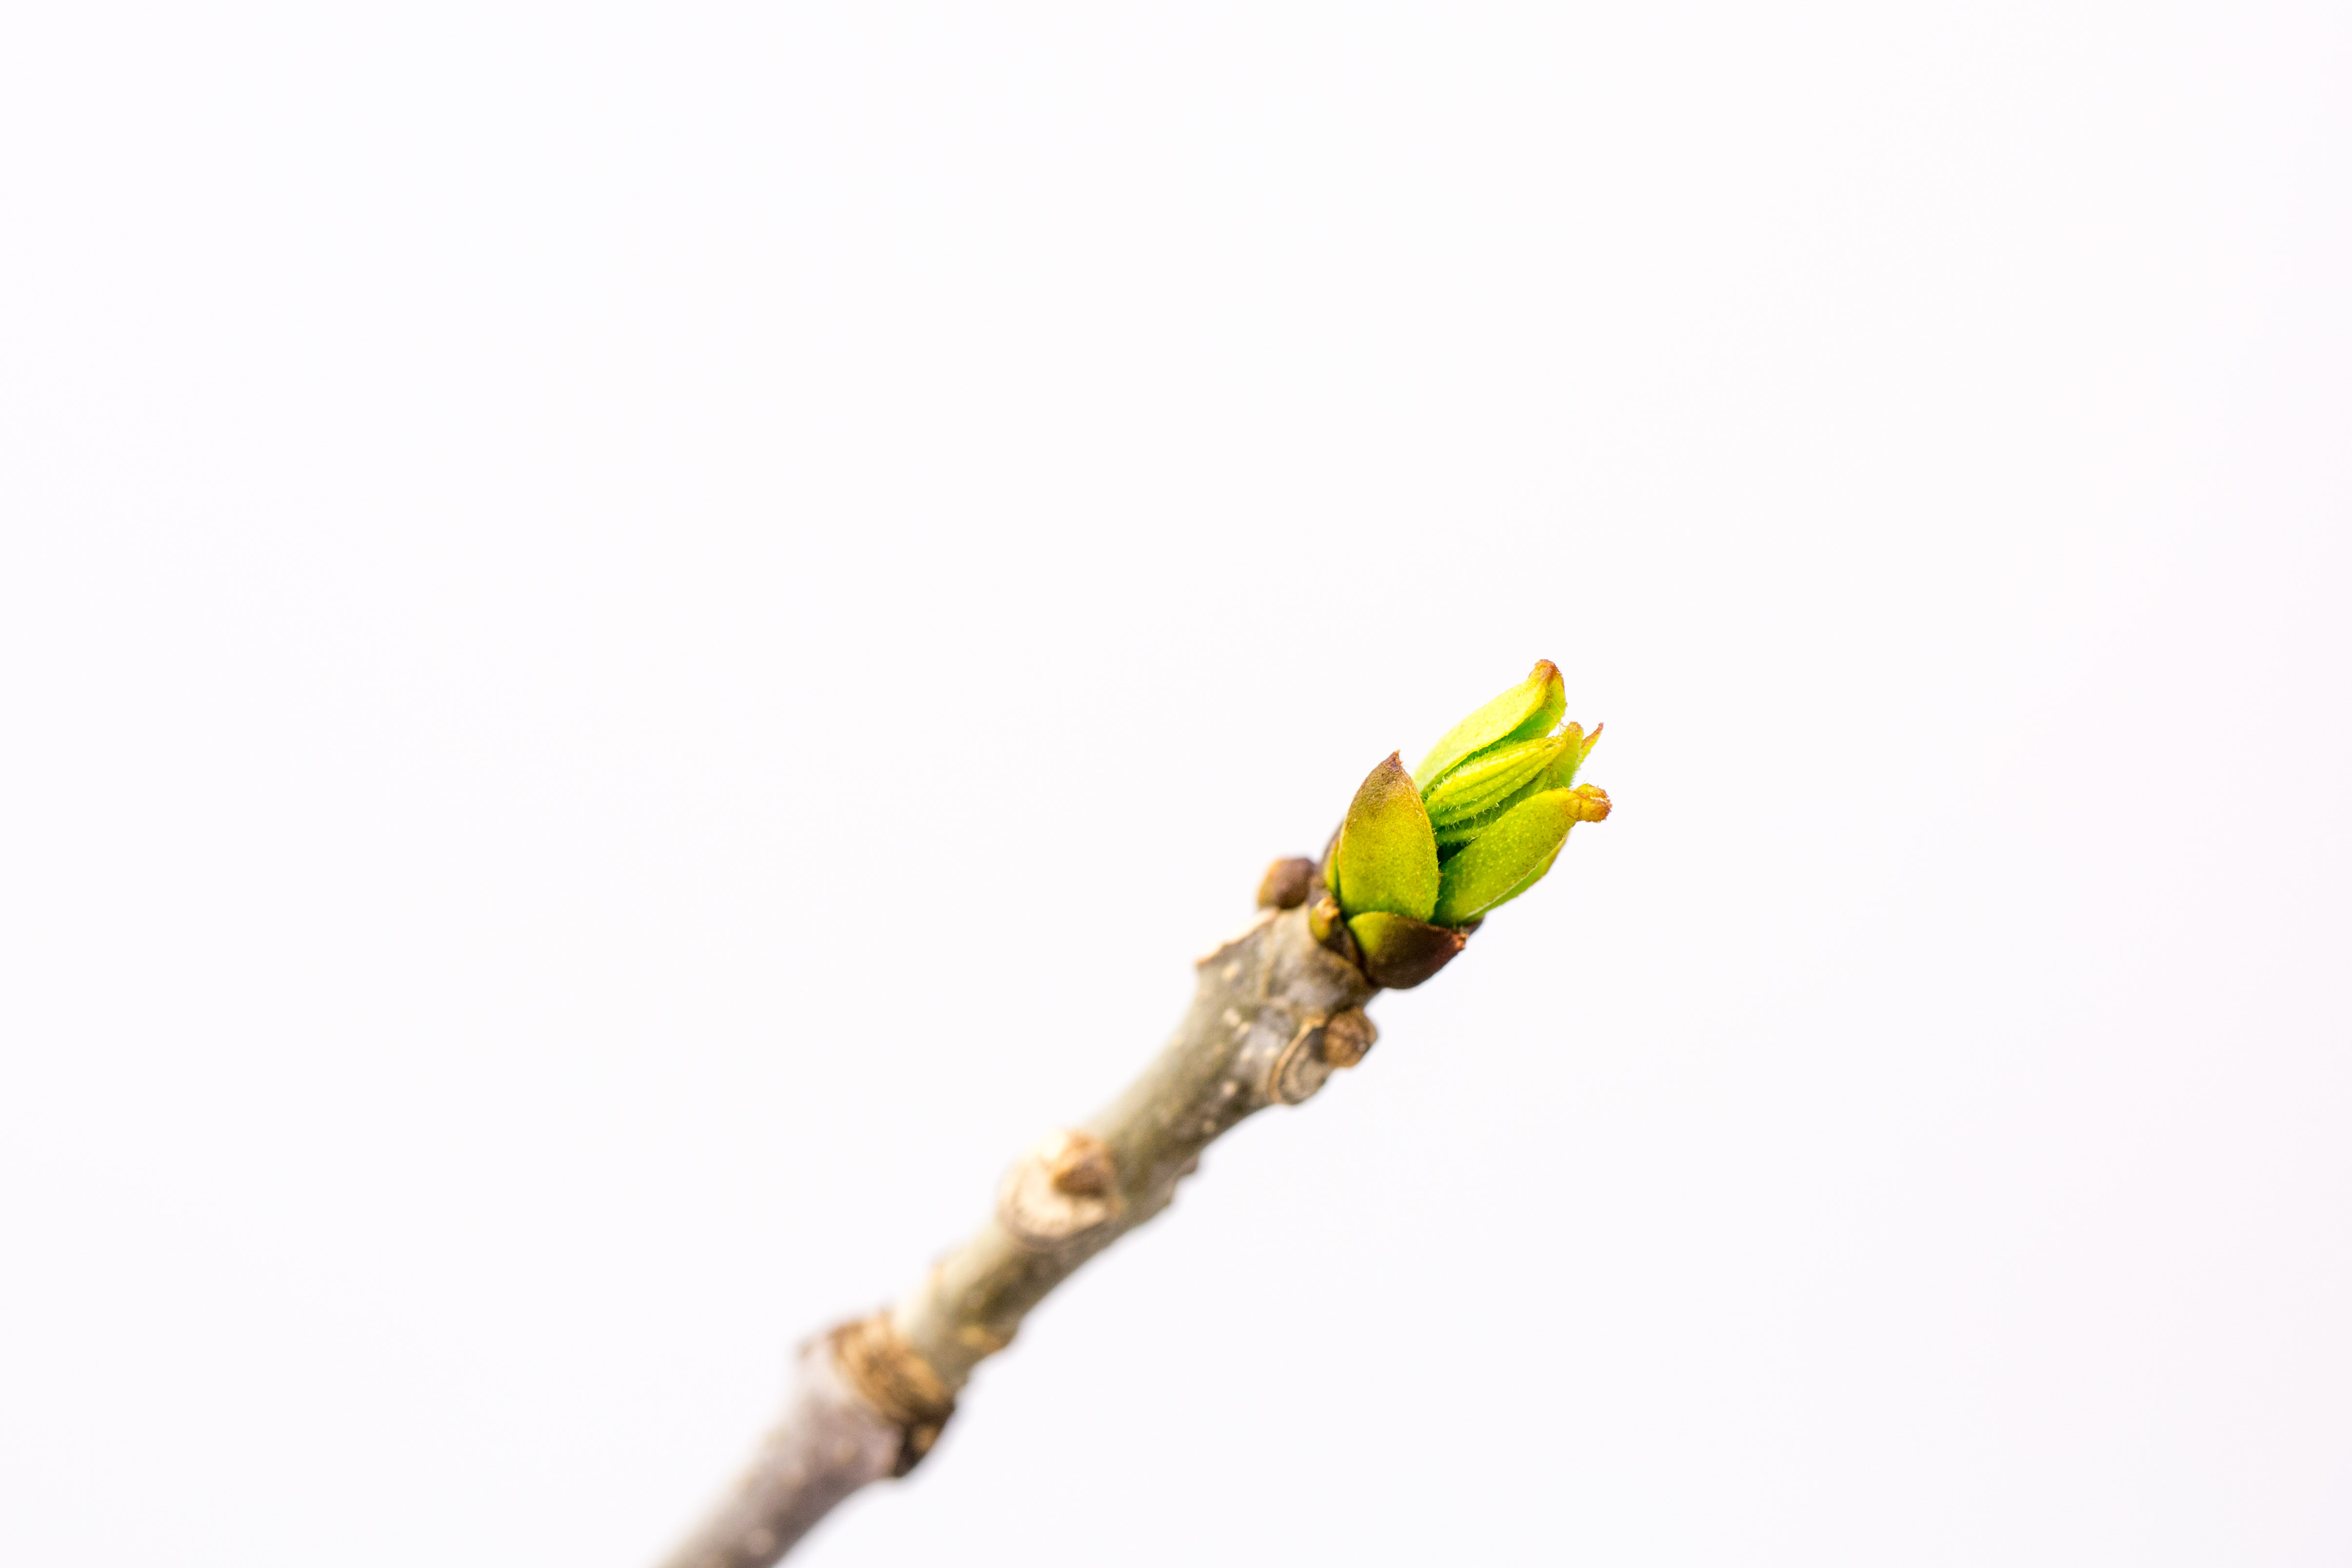
Fraxinus nigra stage 07
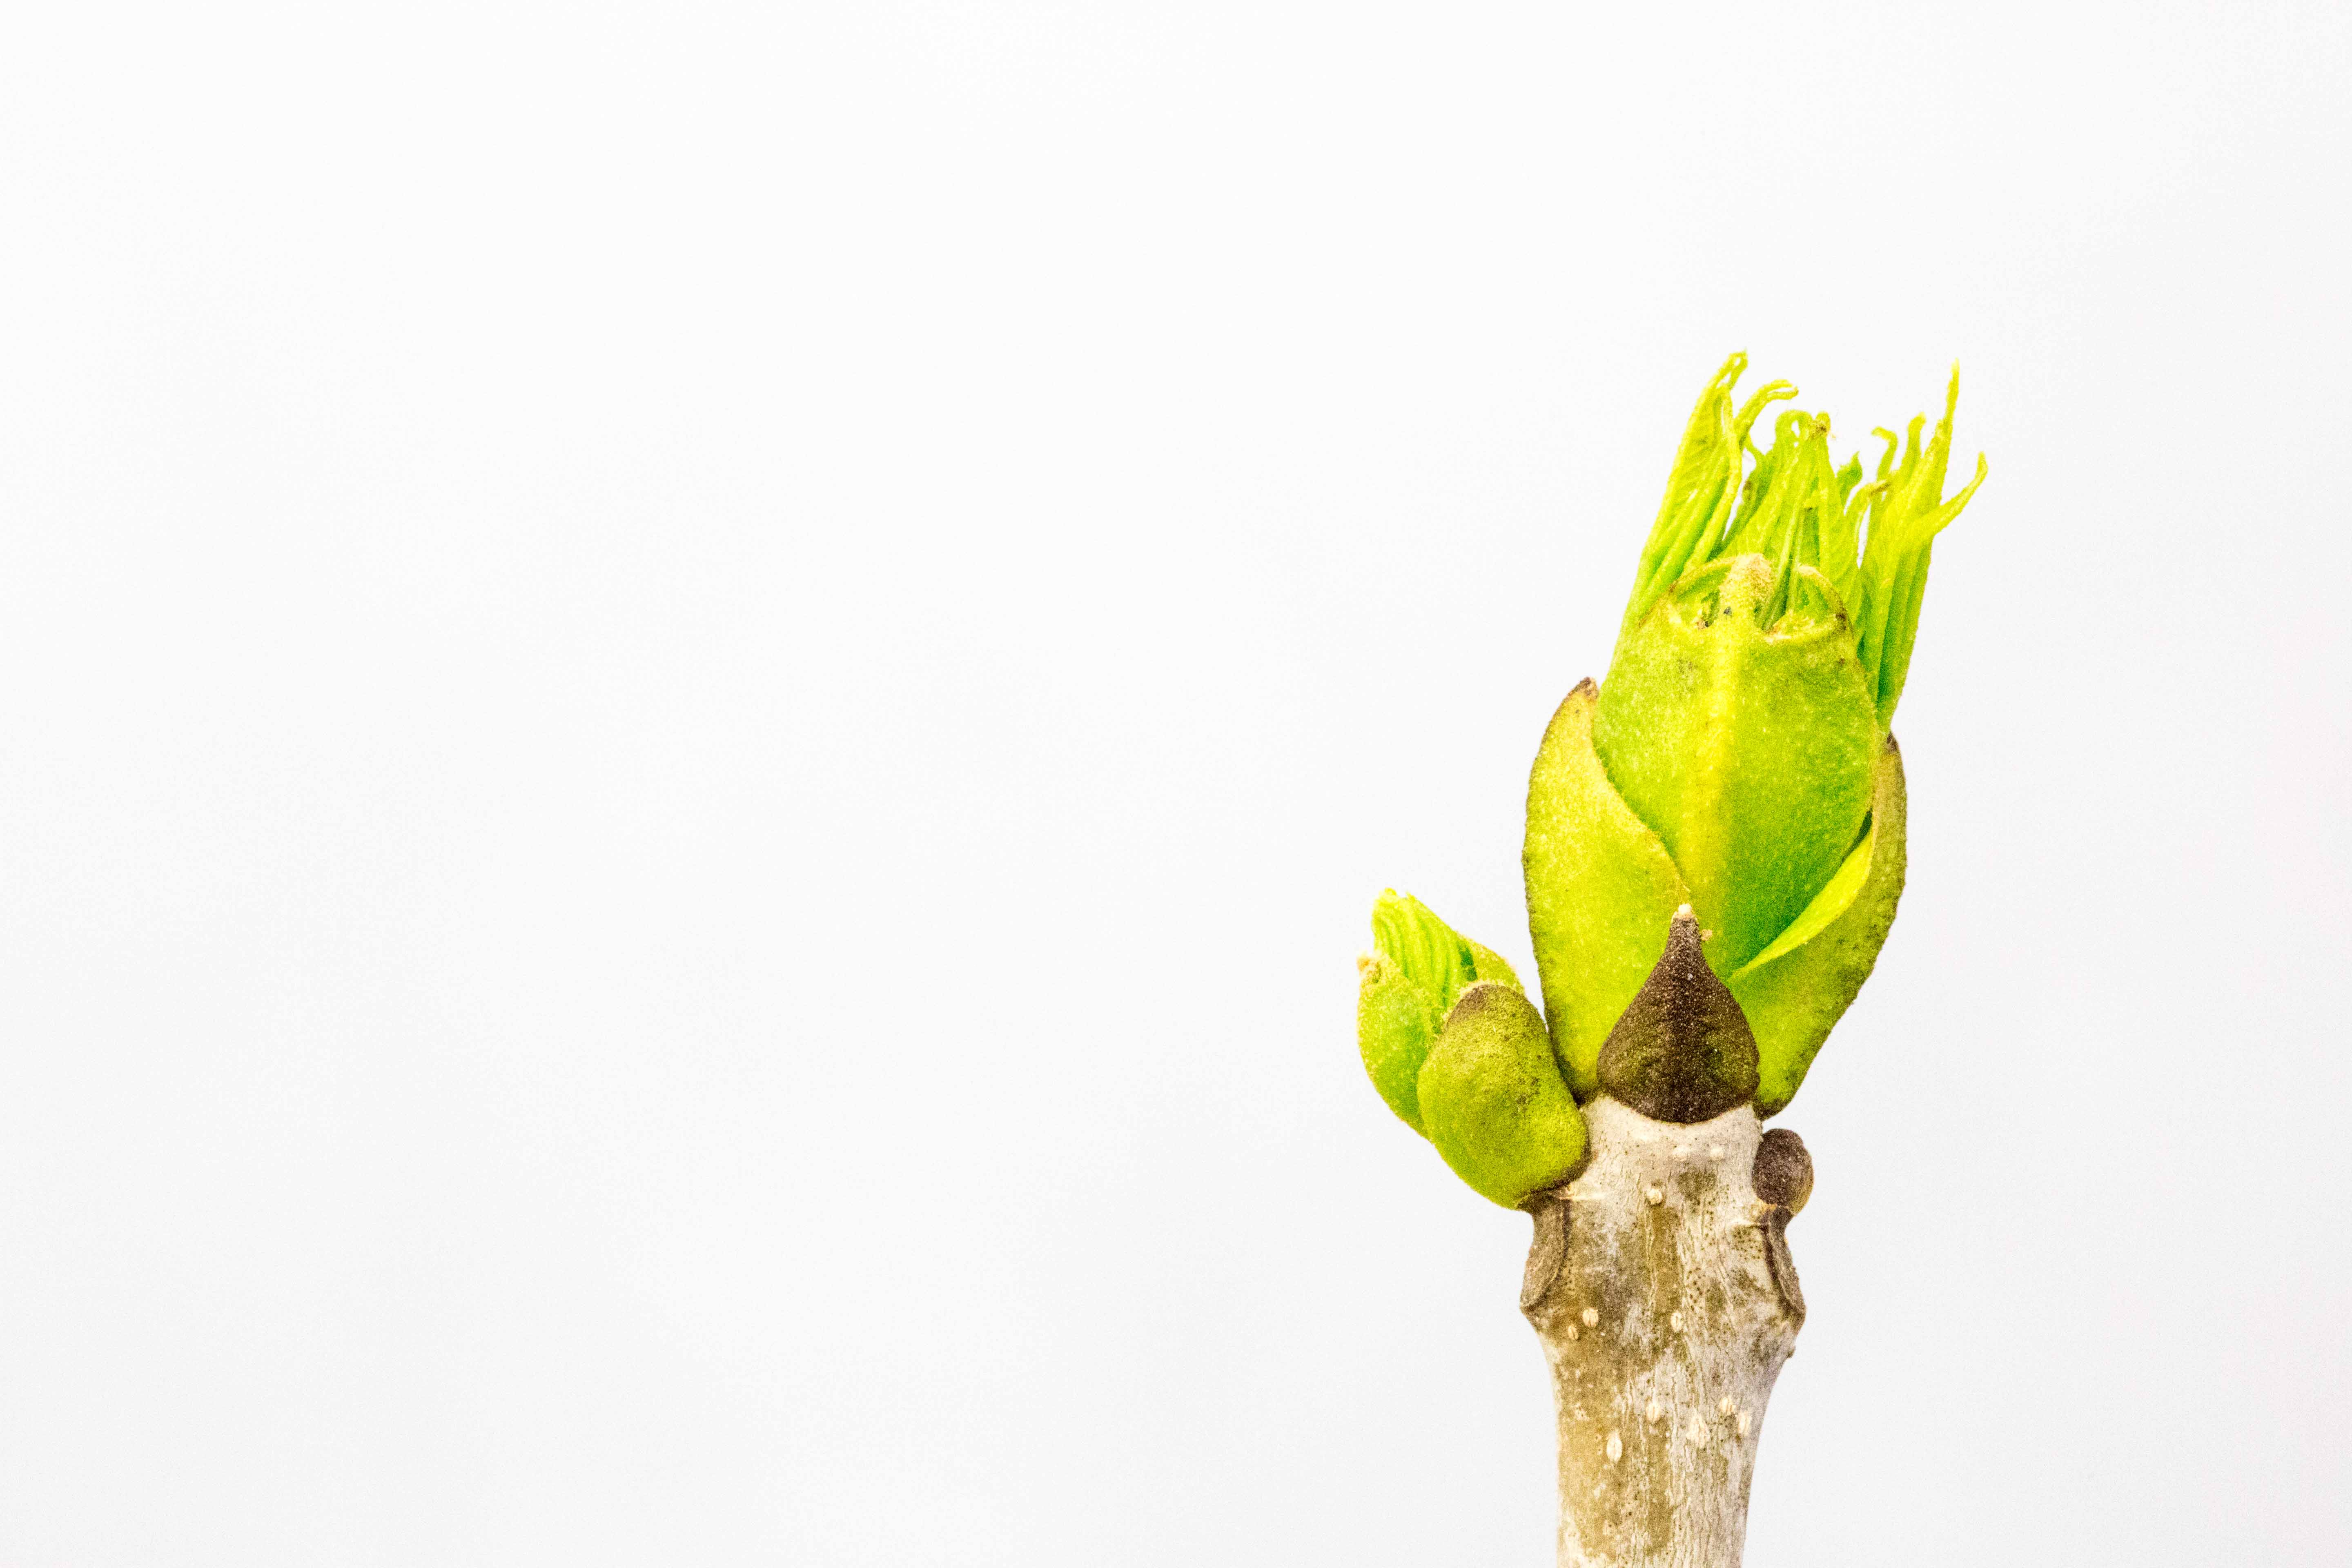
Fraxinus nigra stage 10
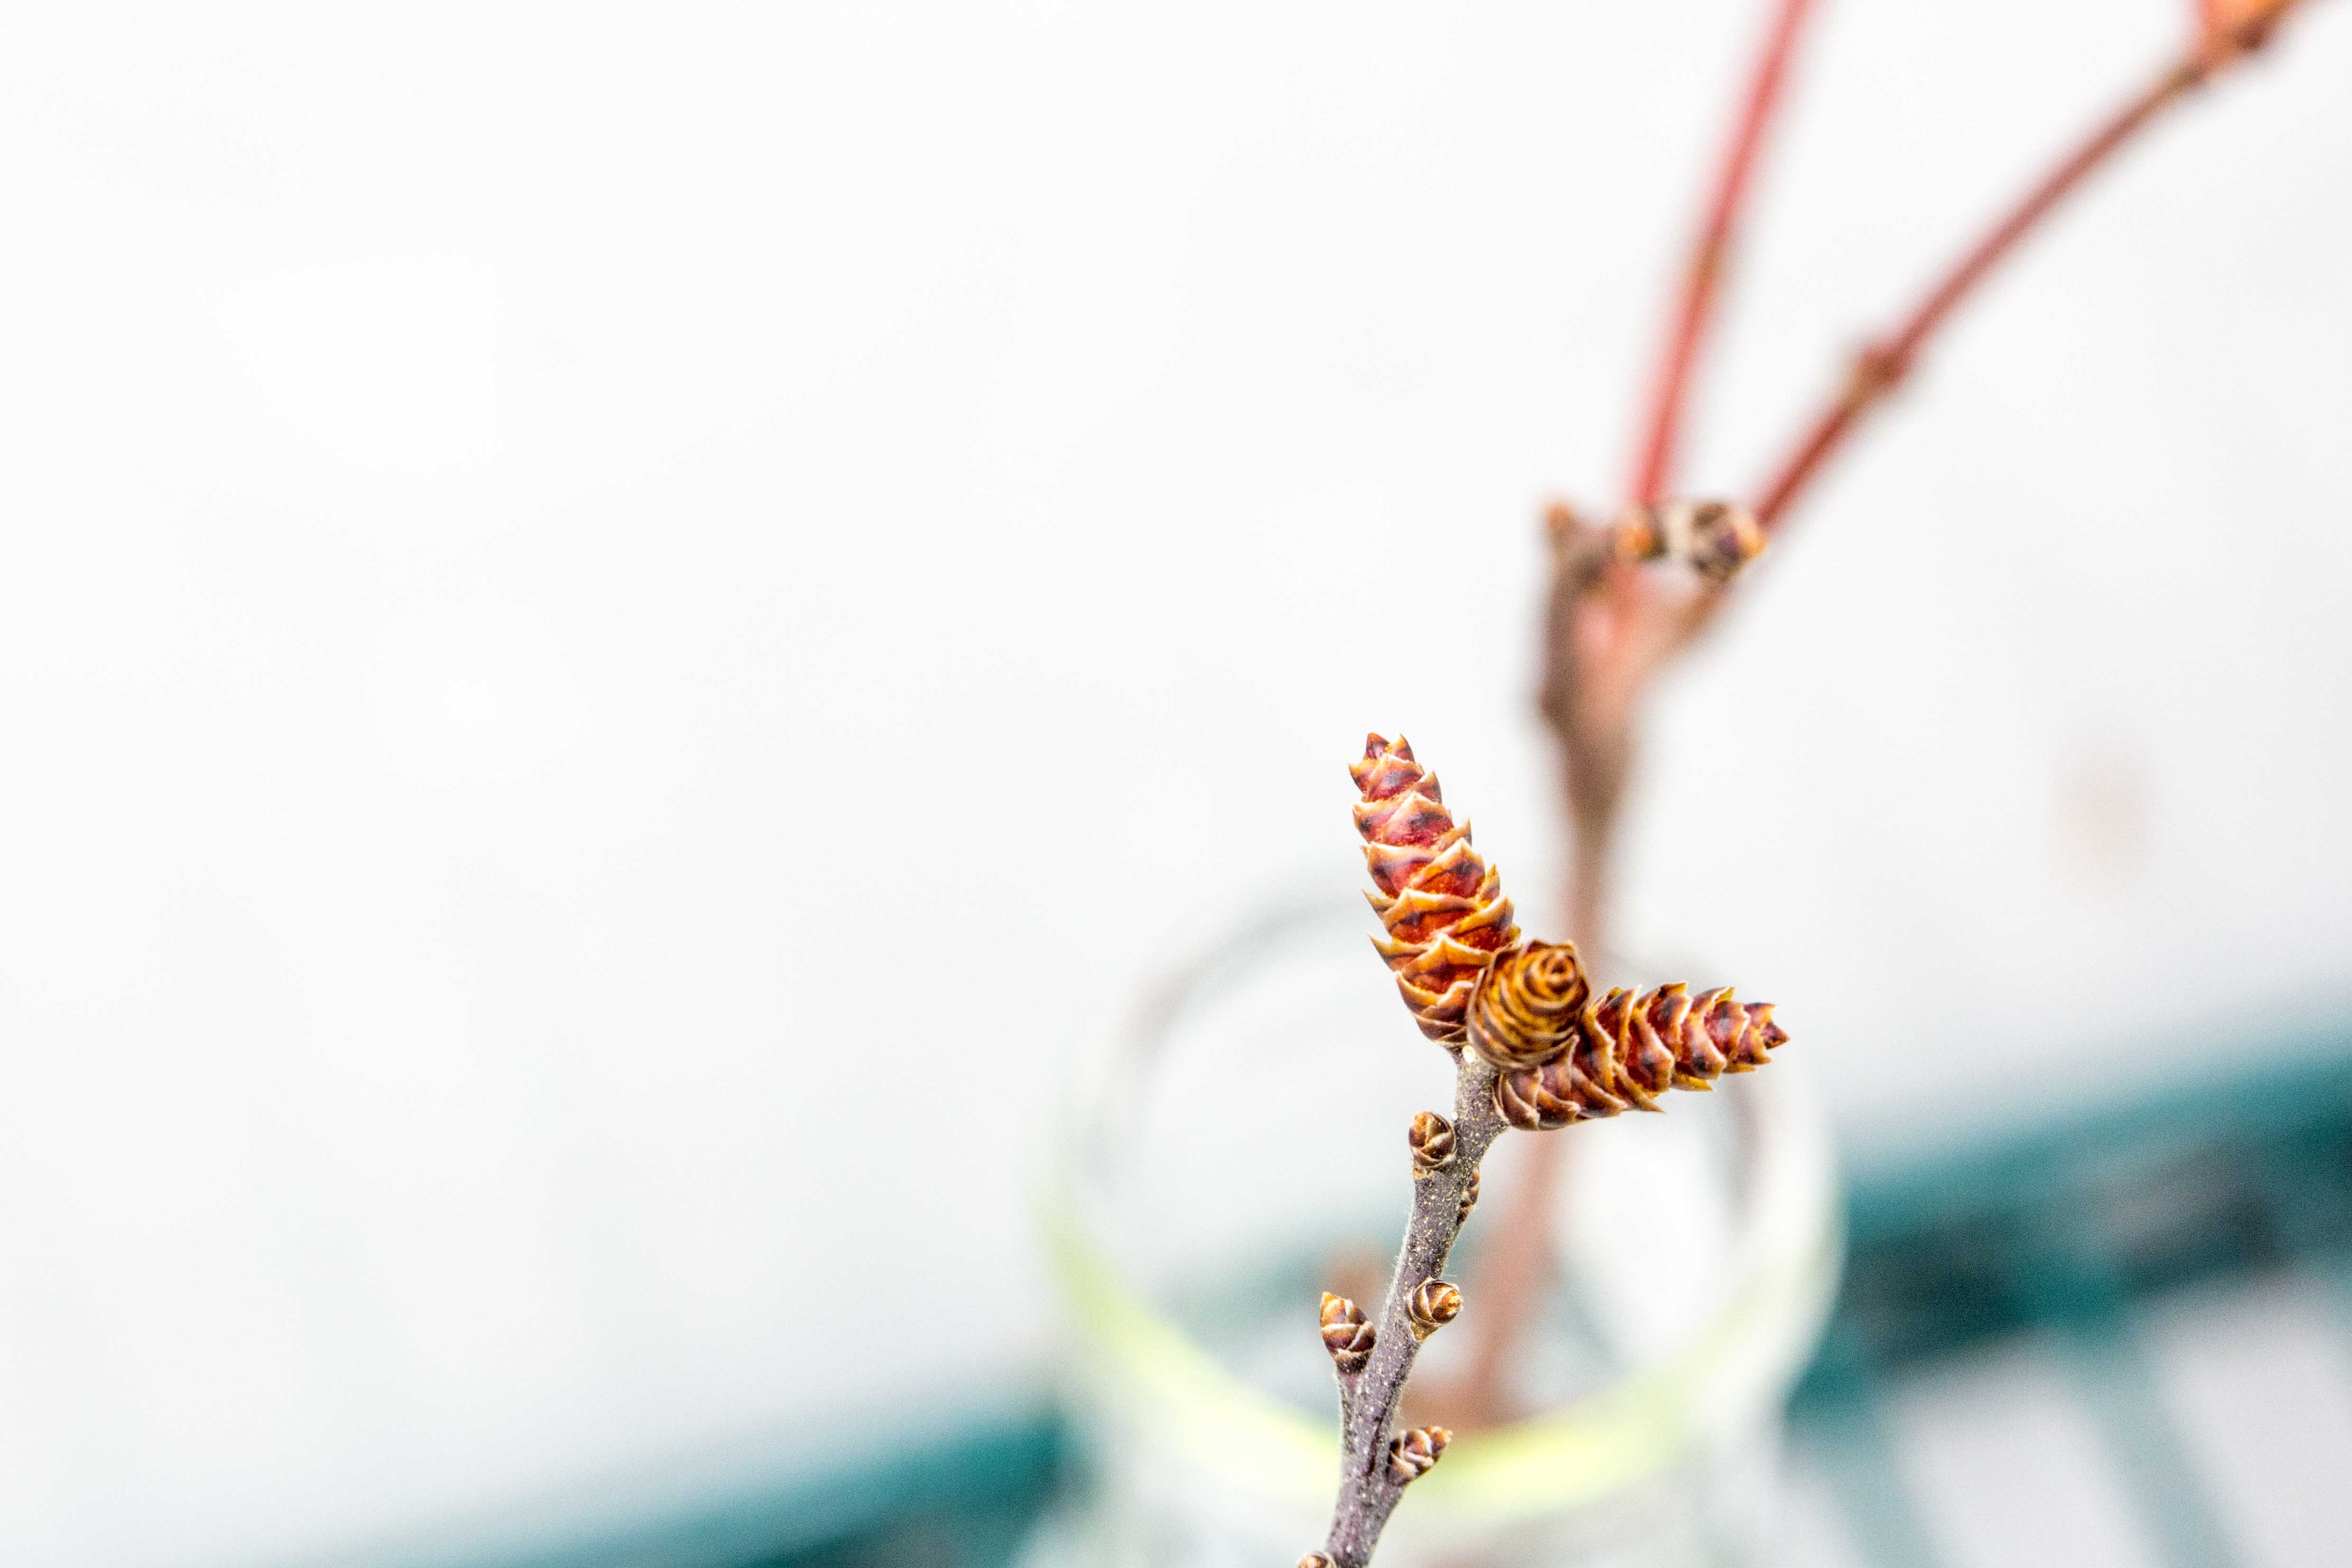
Myrica gale stage 01
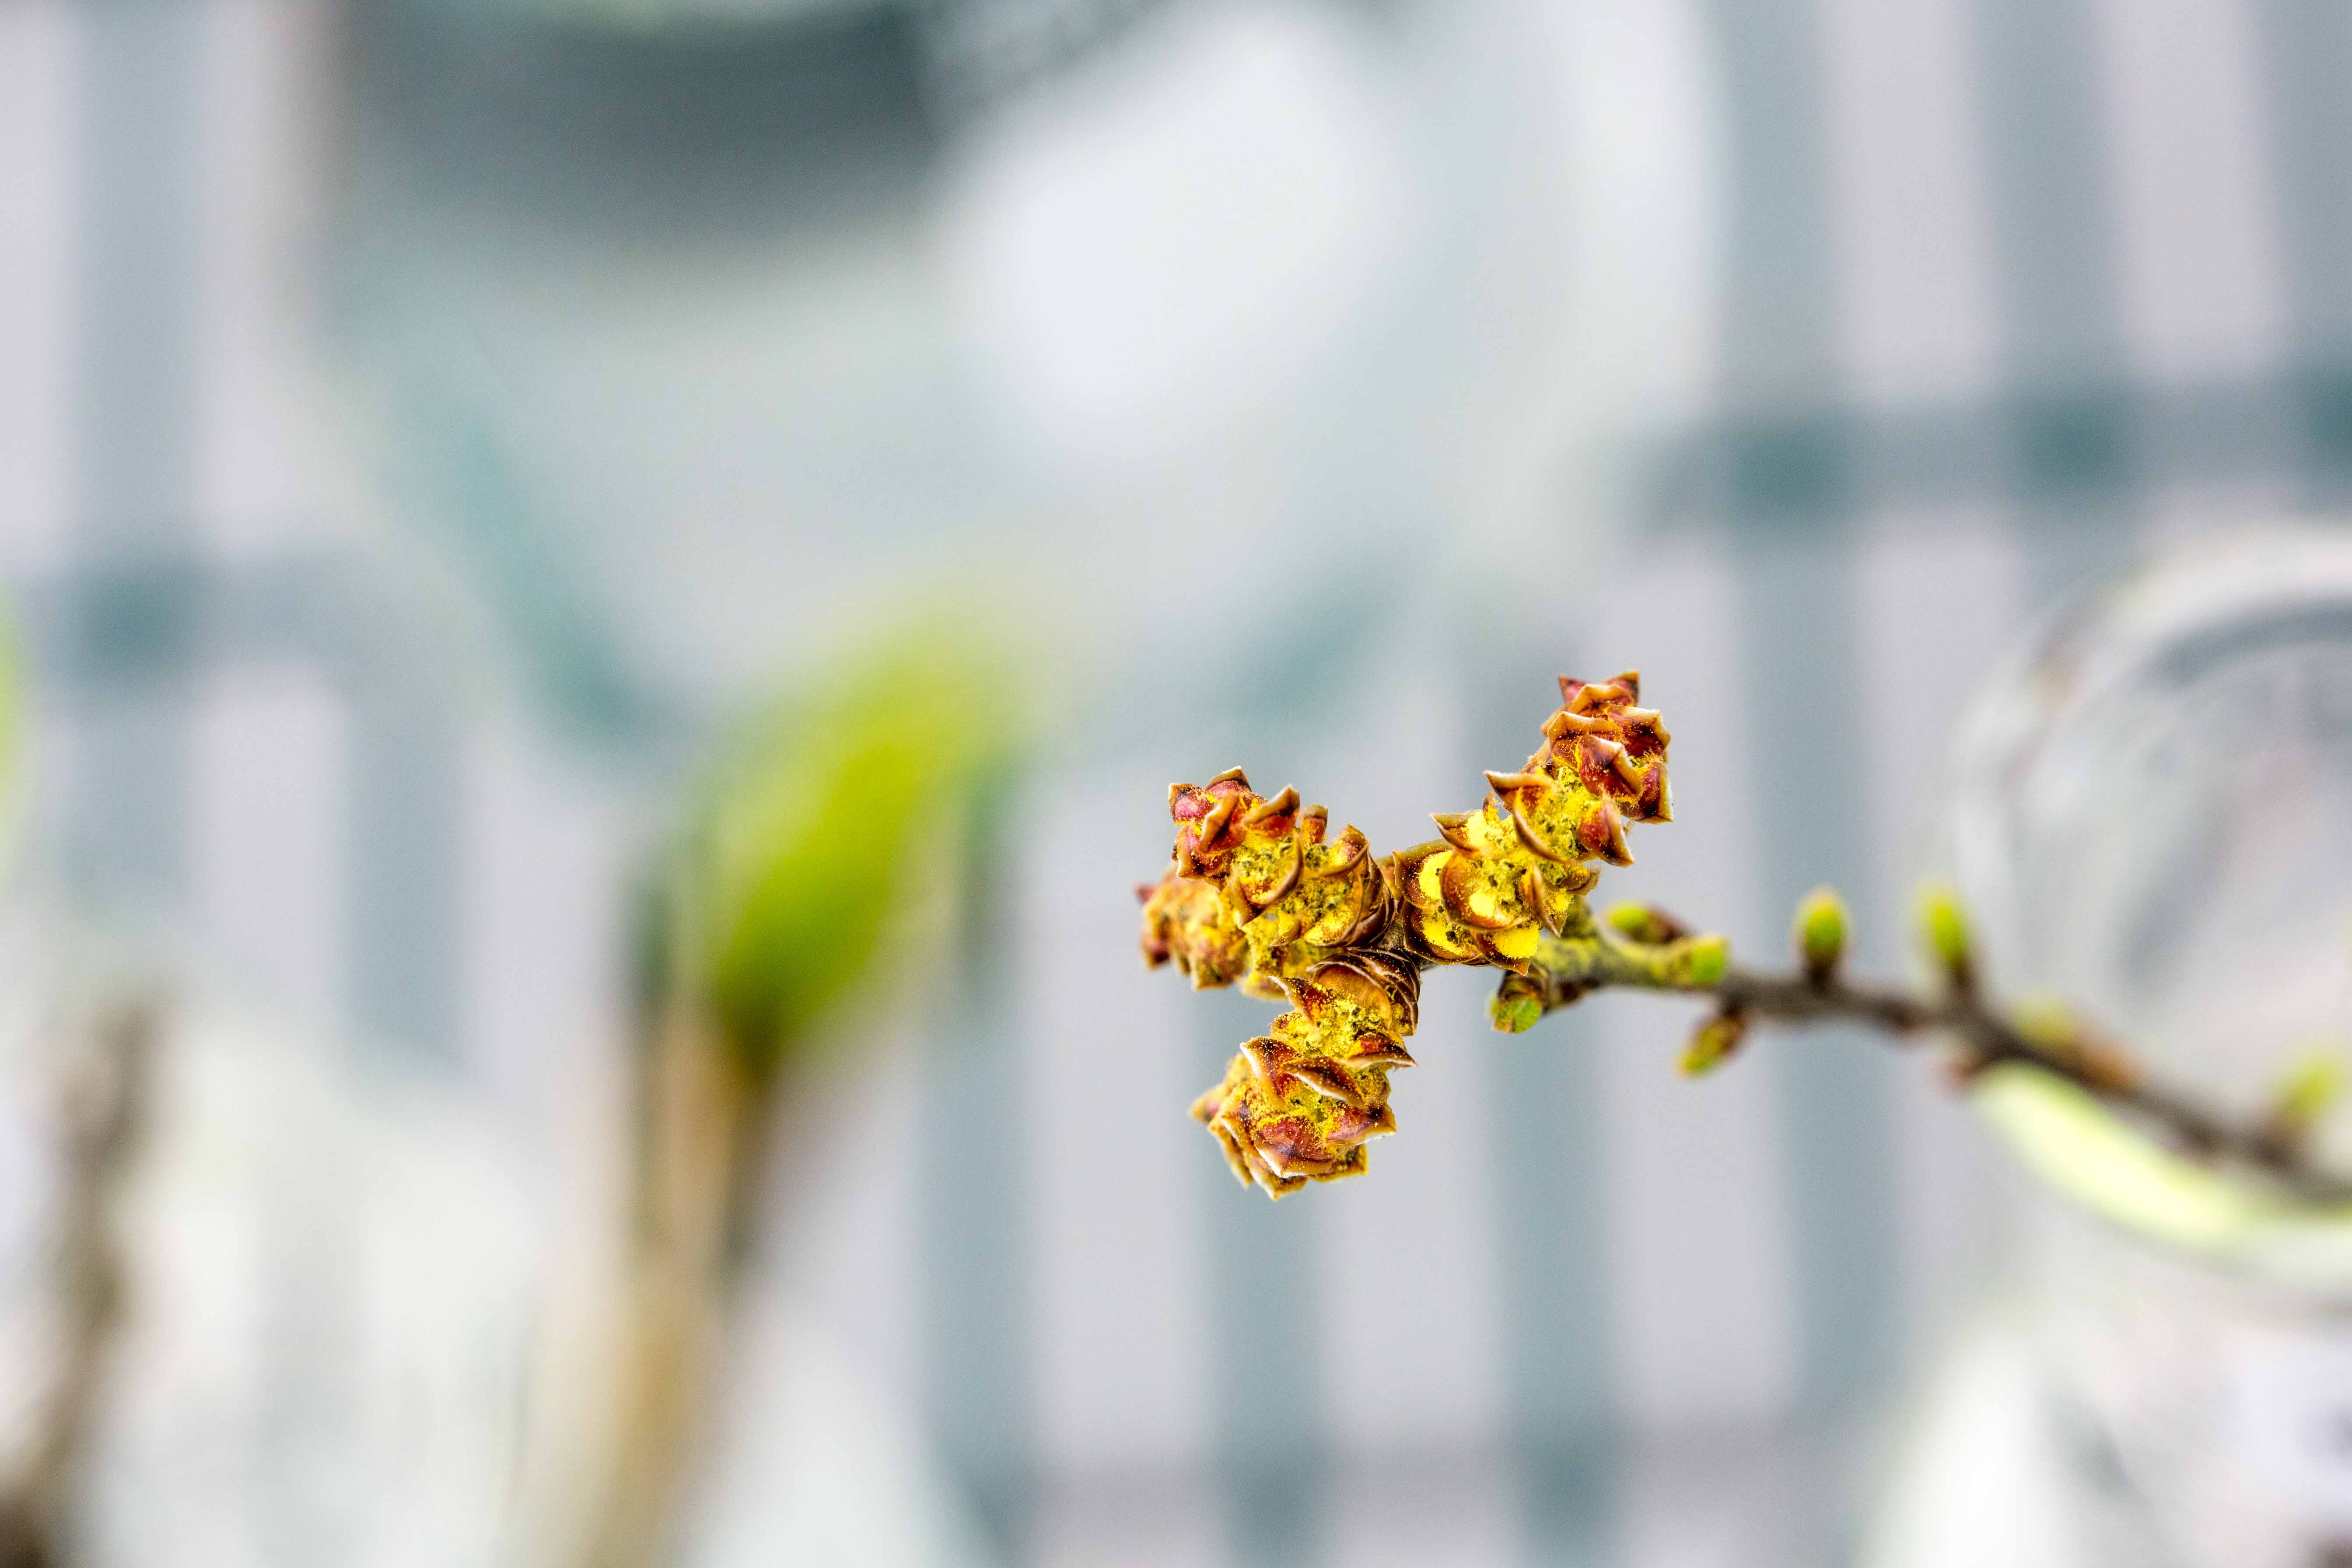
Myrica gale stage 65
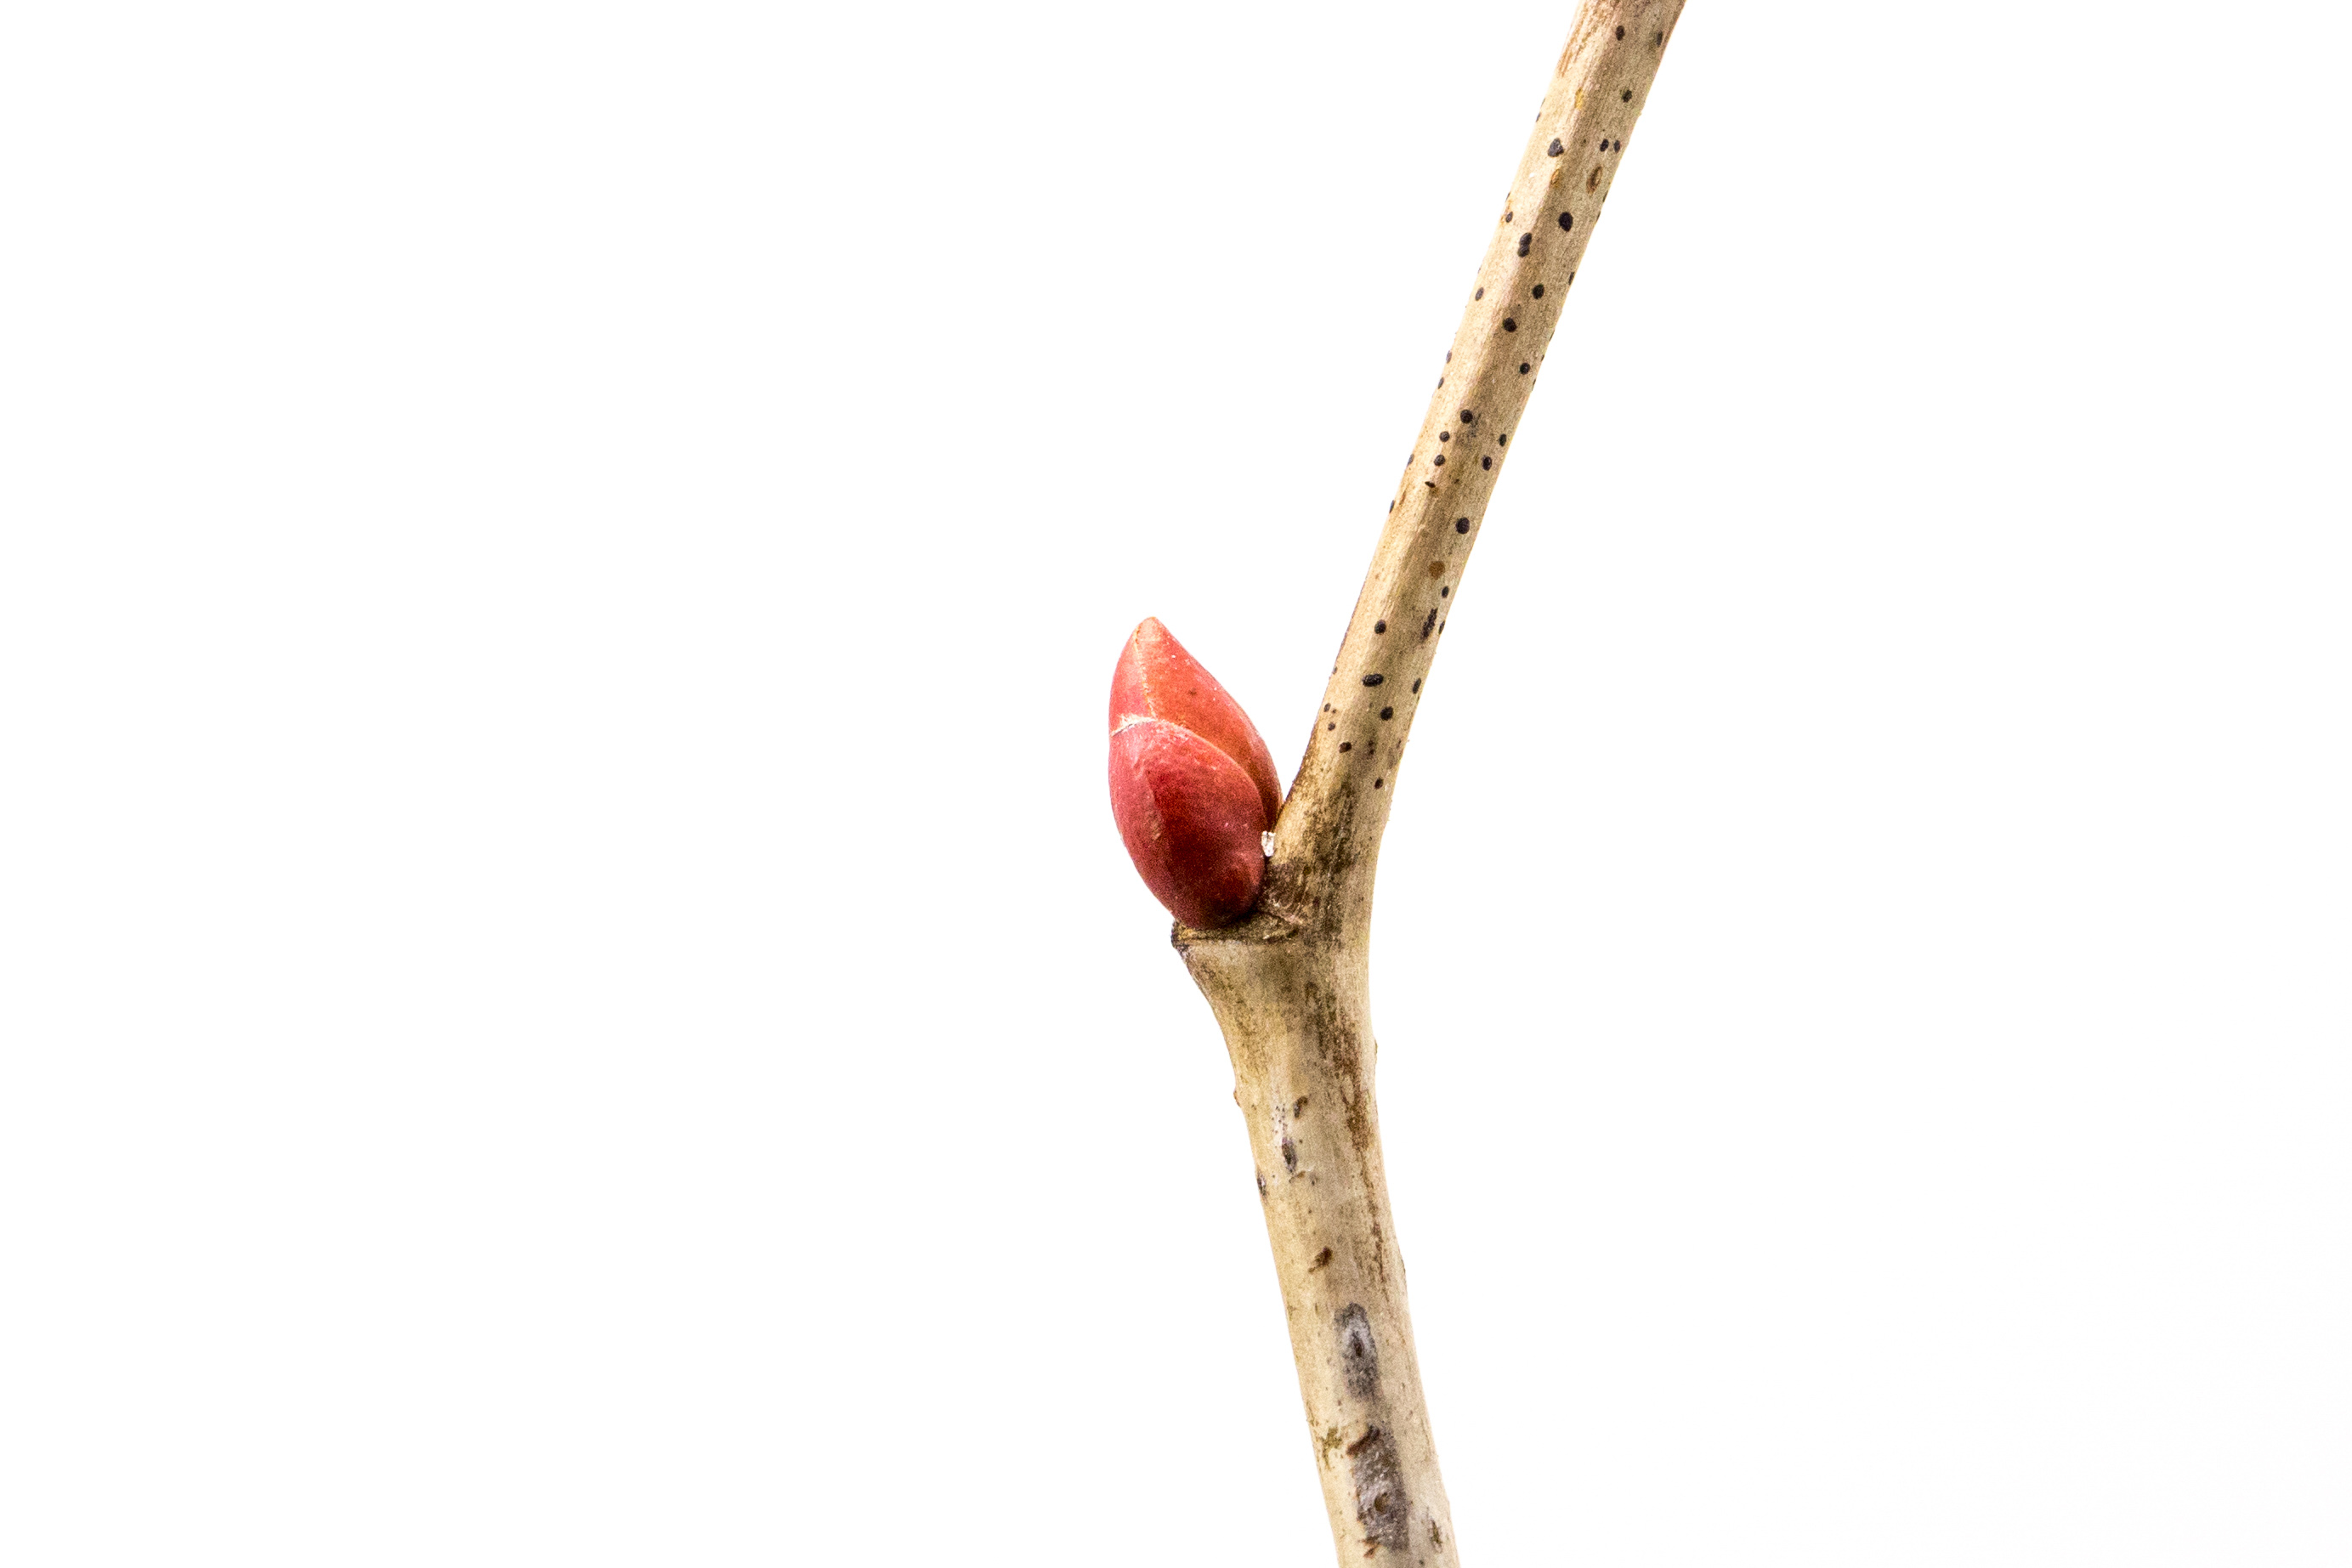
Tilia americana stage 00
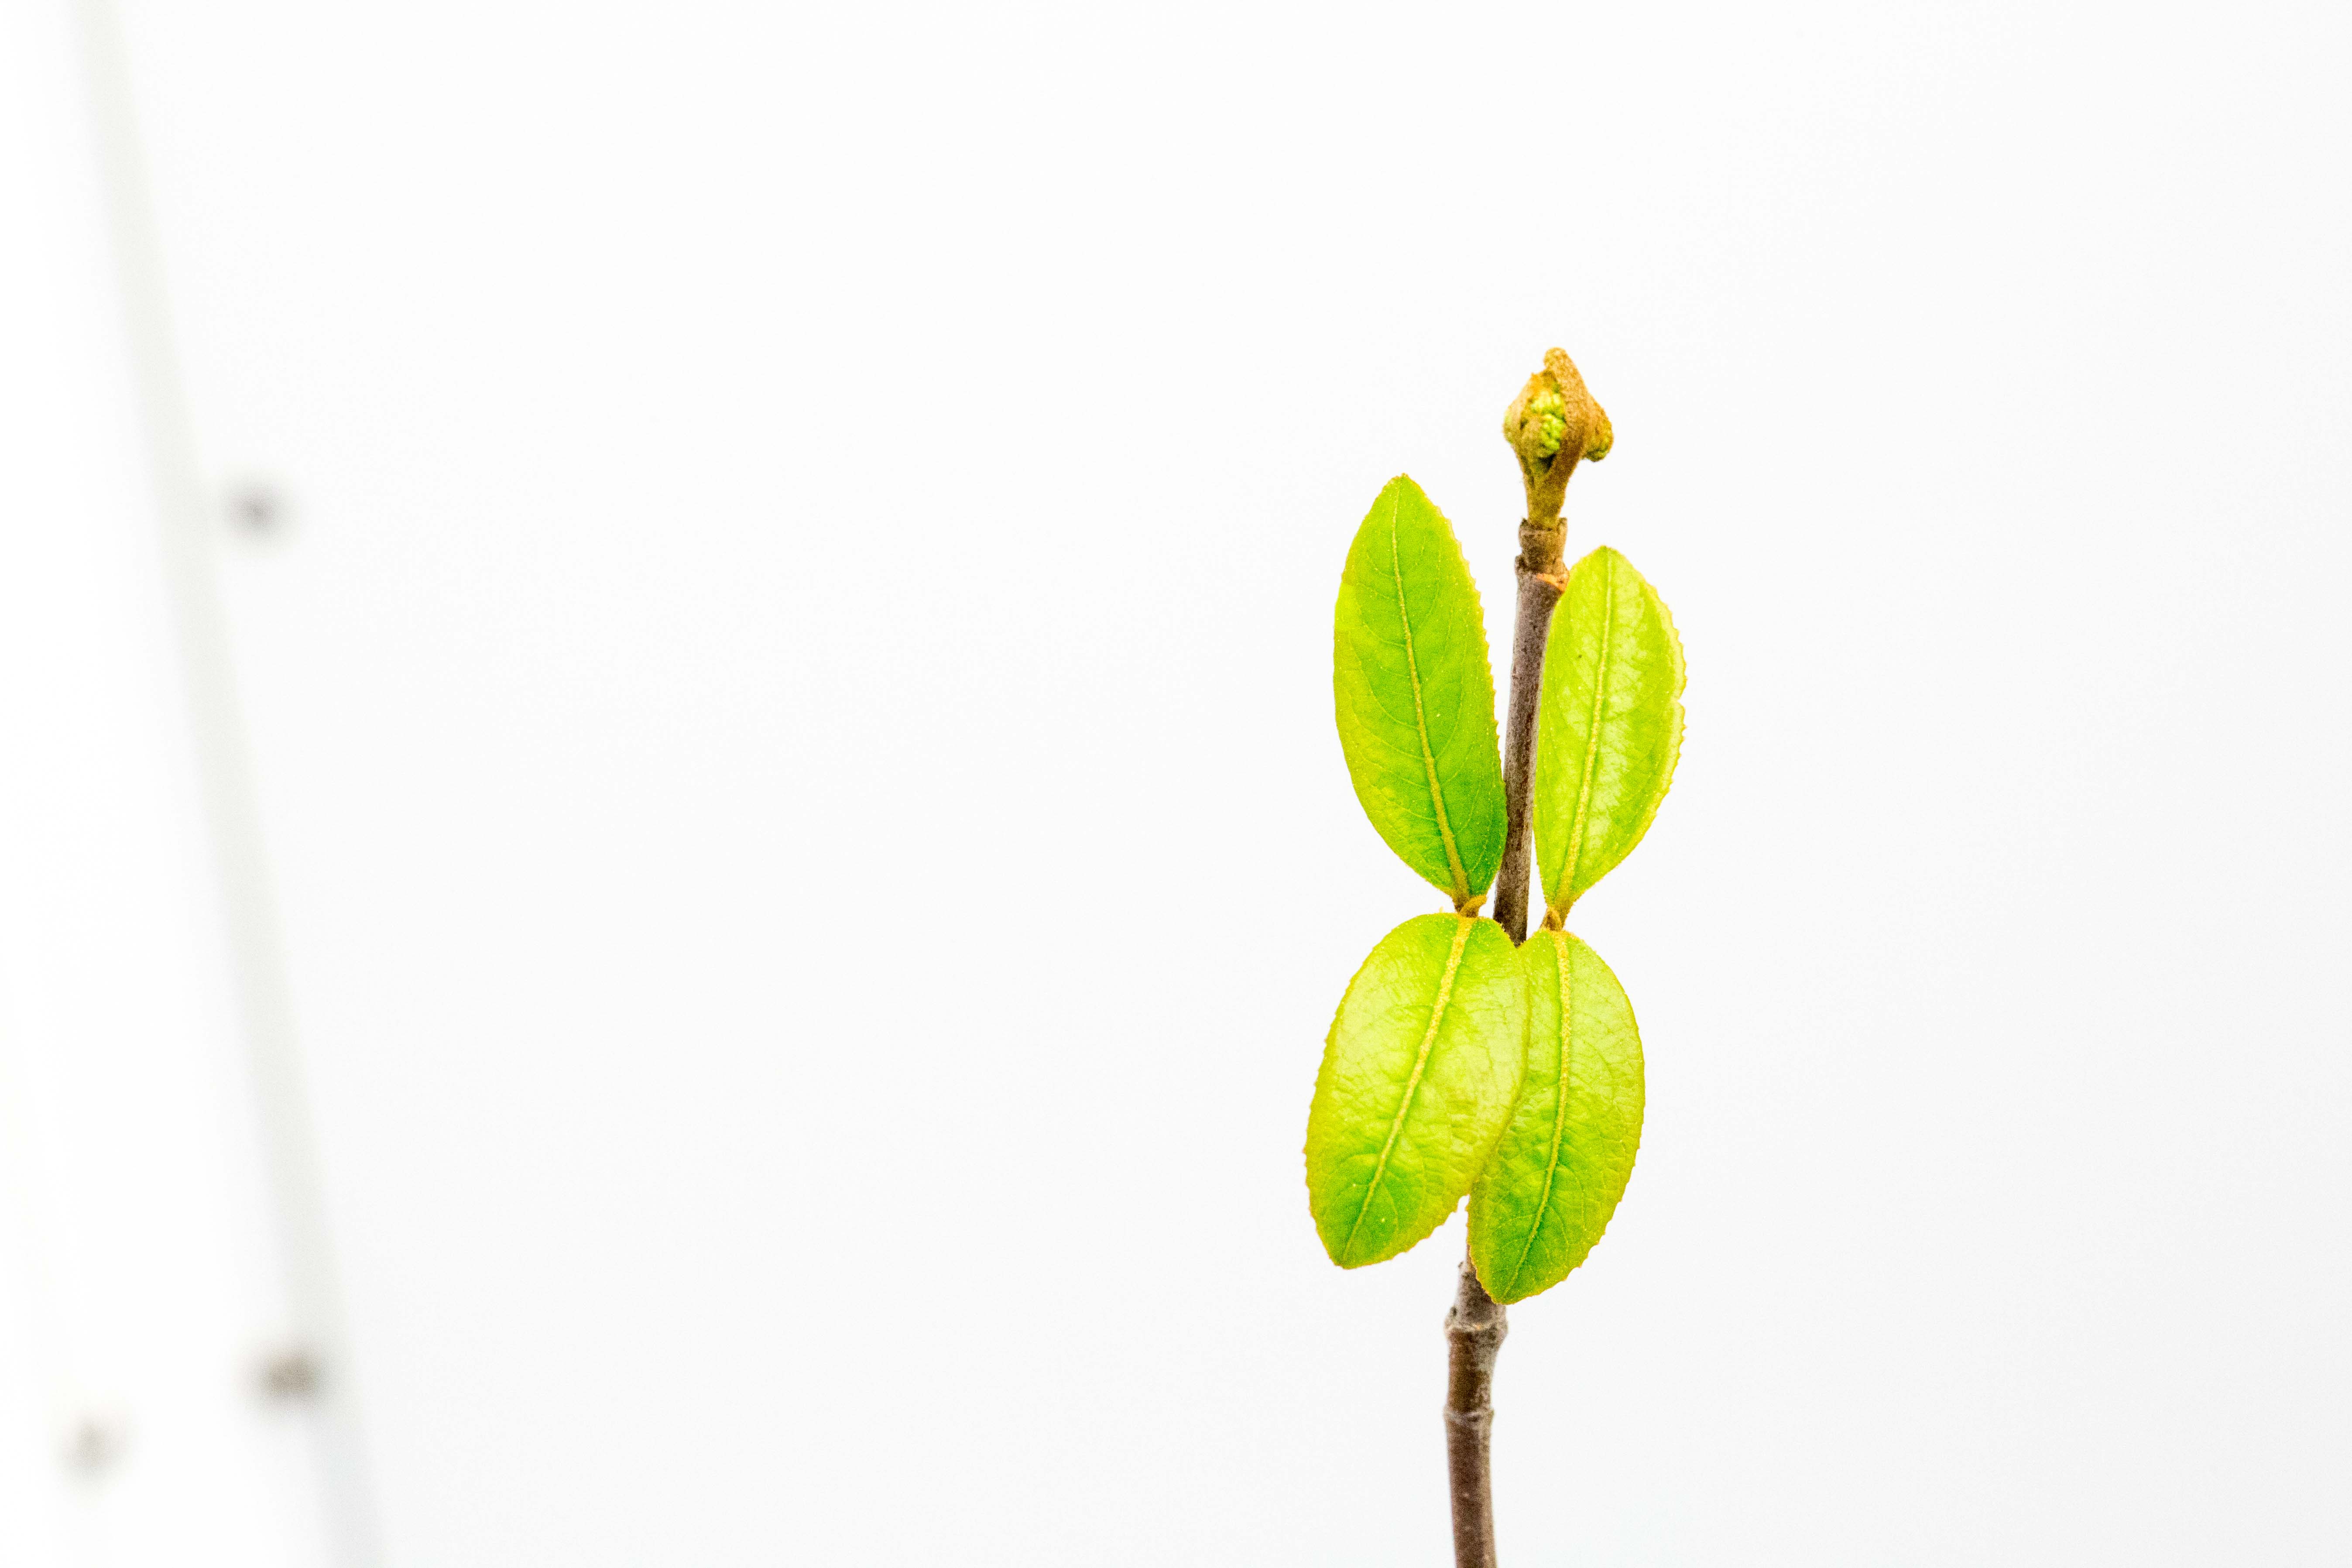
Viburnum cassinoides stage 15
Viburnum cassinoides stage 92
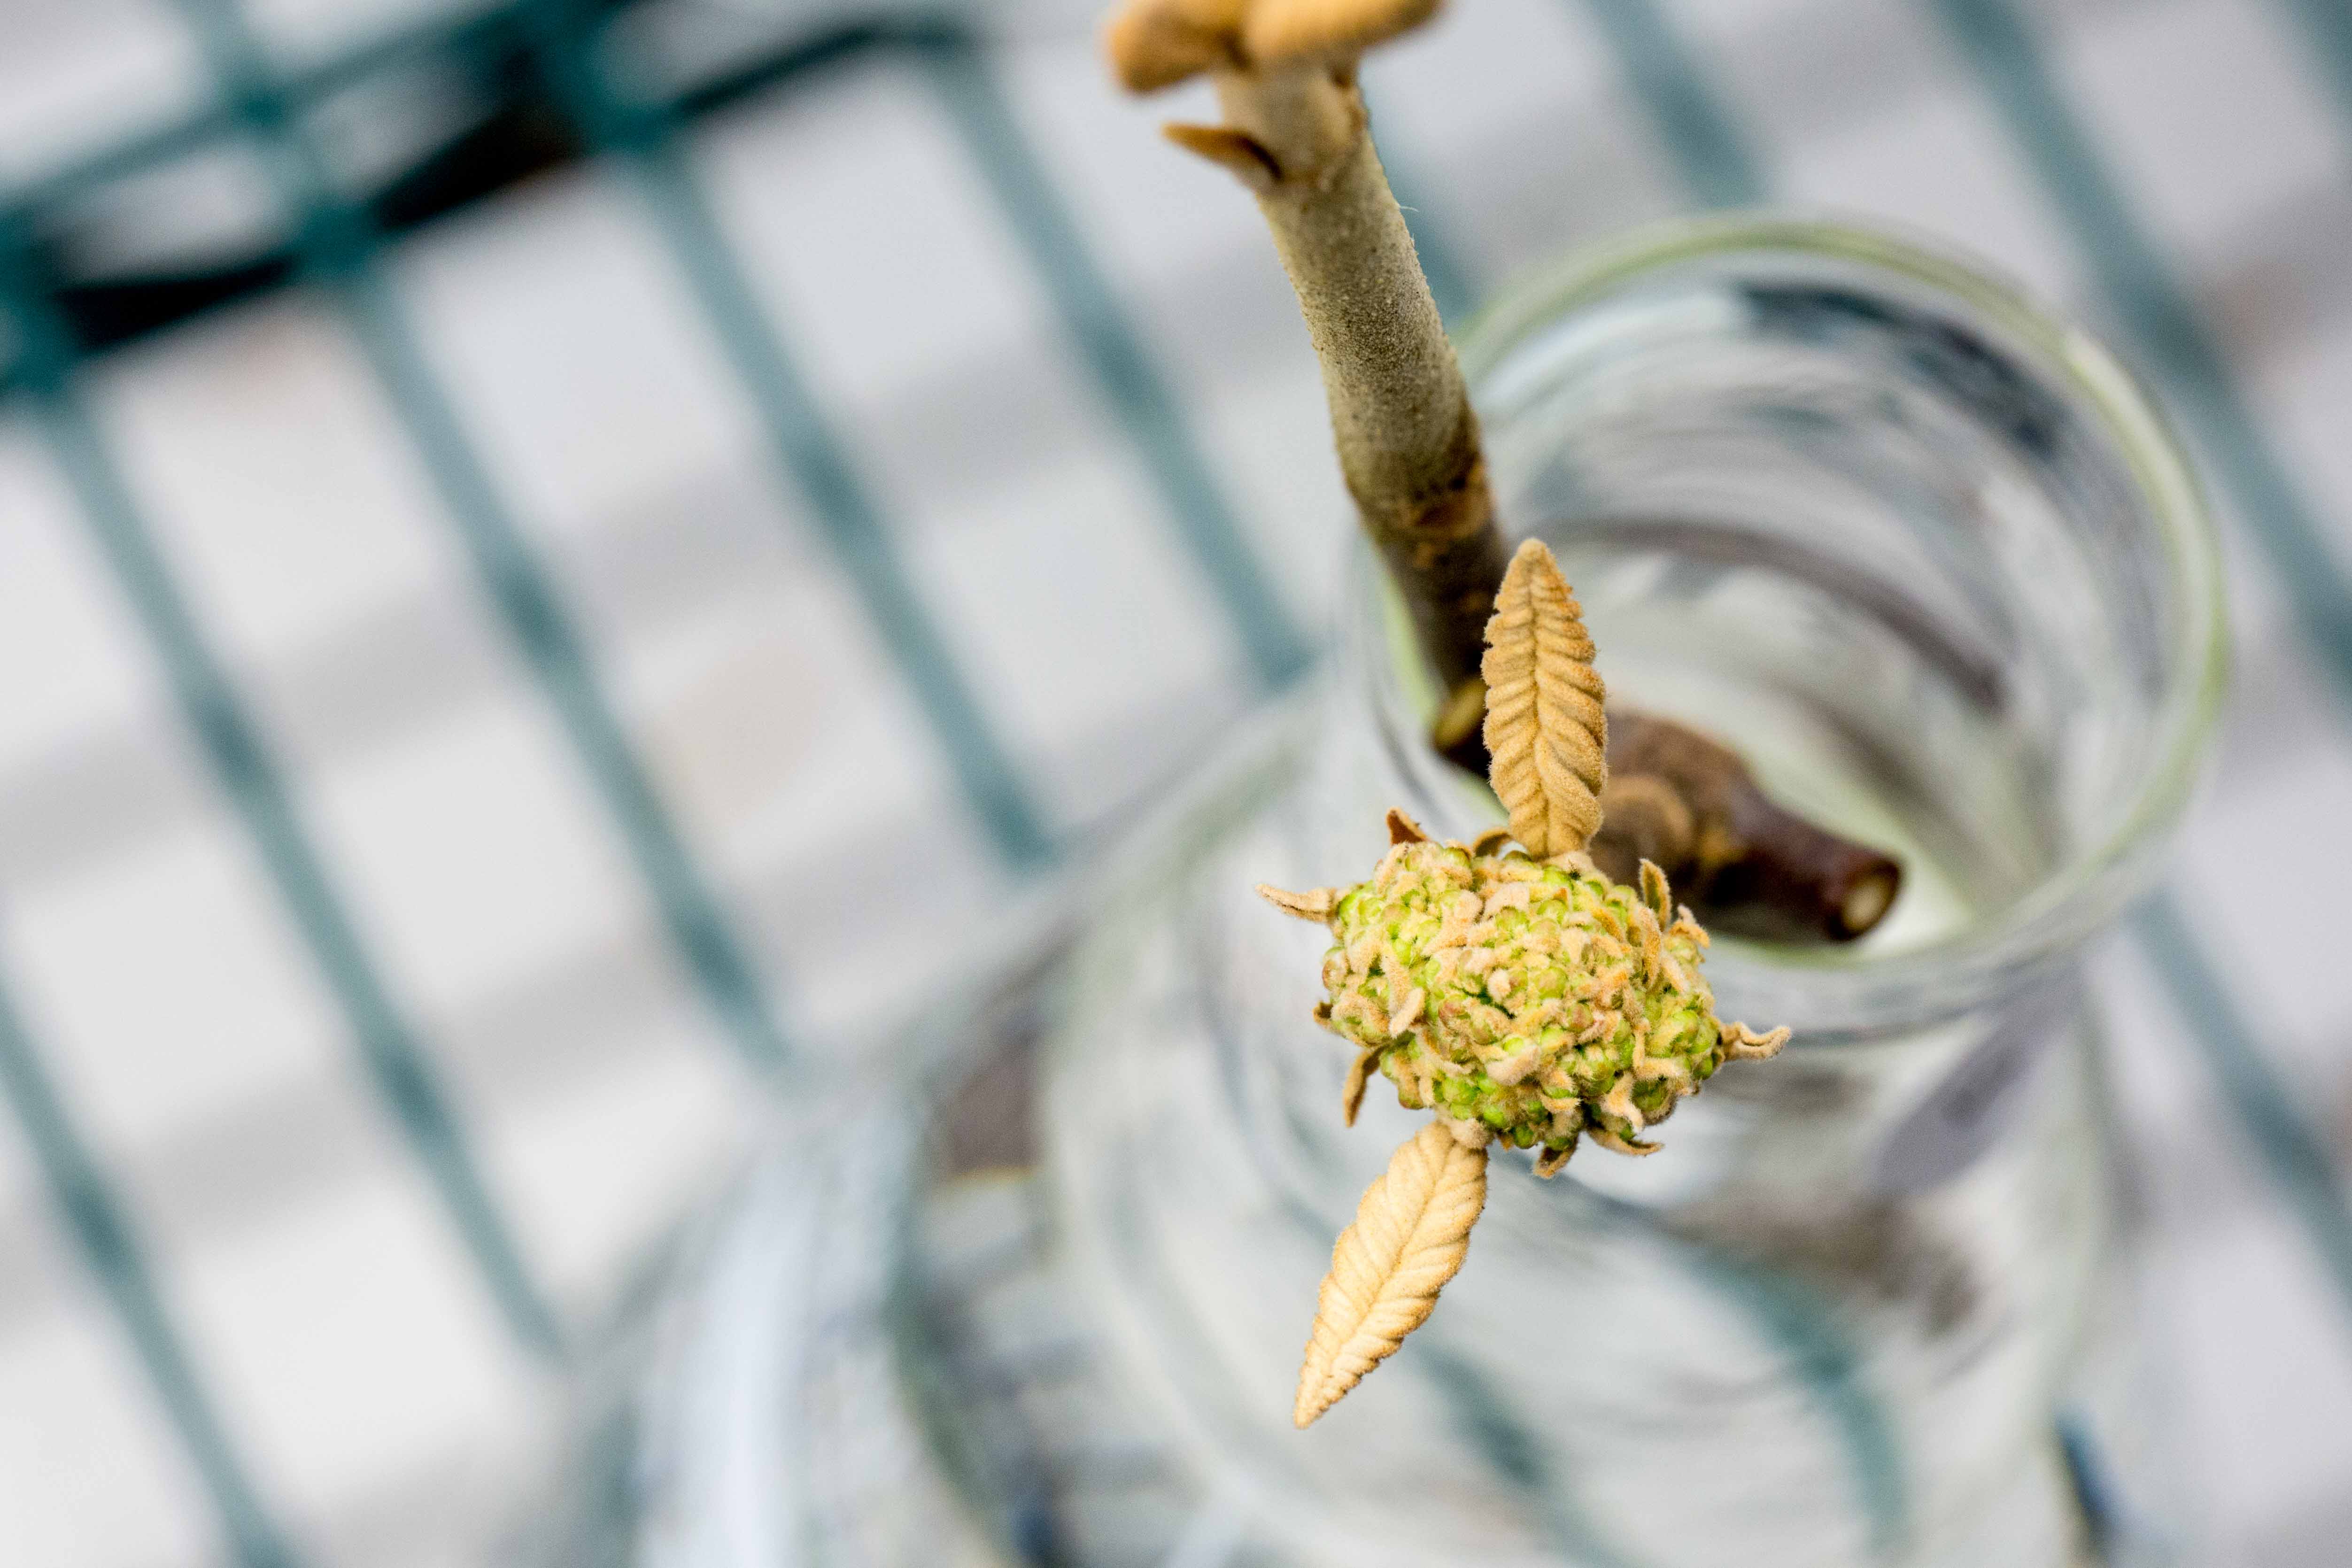
iburnum lantanoides stage 55
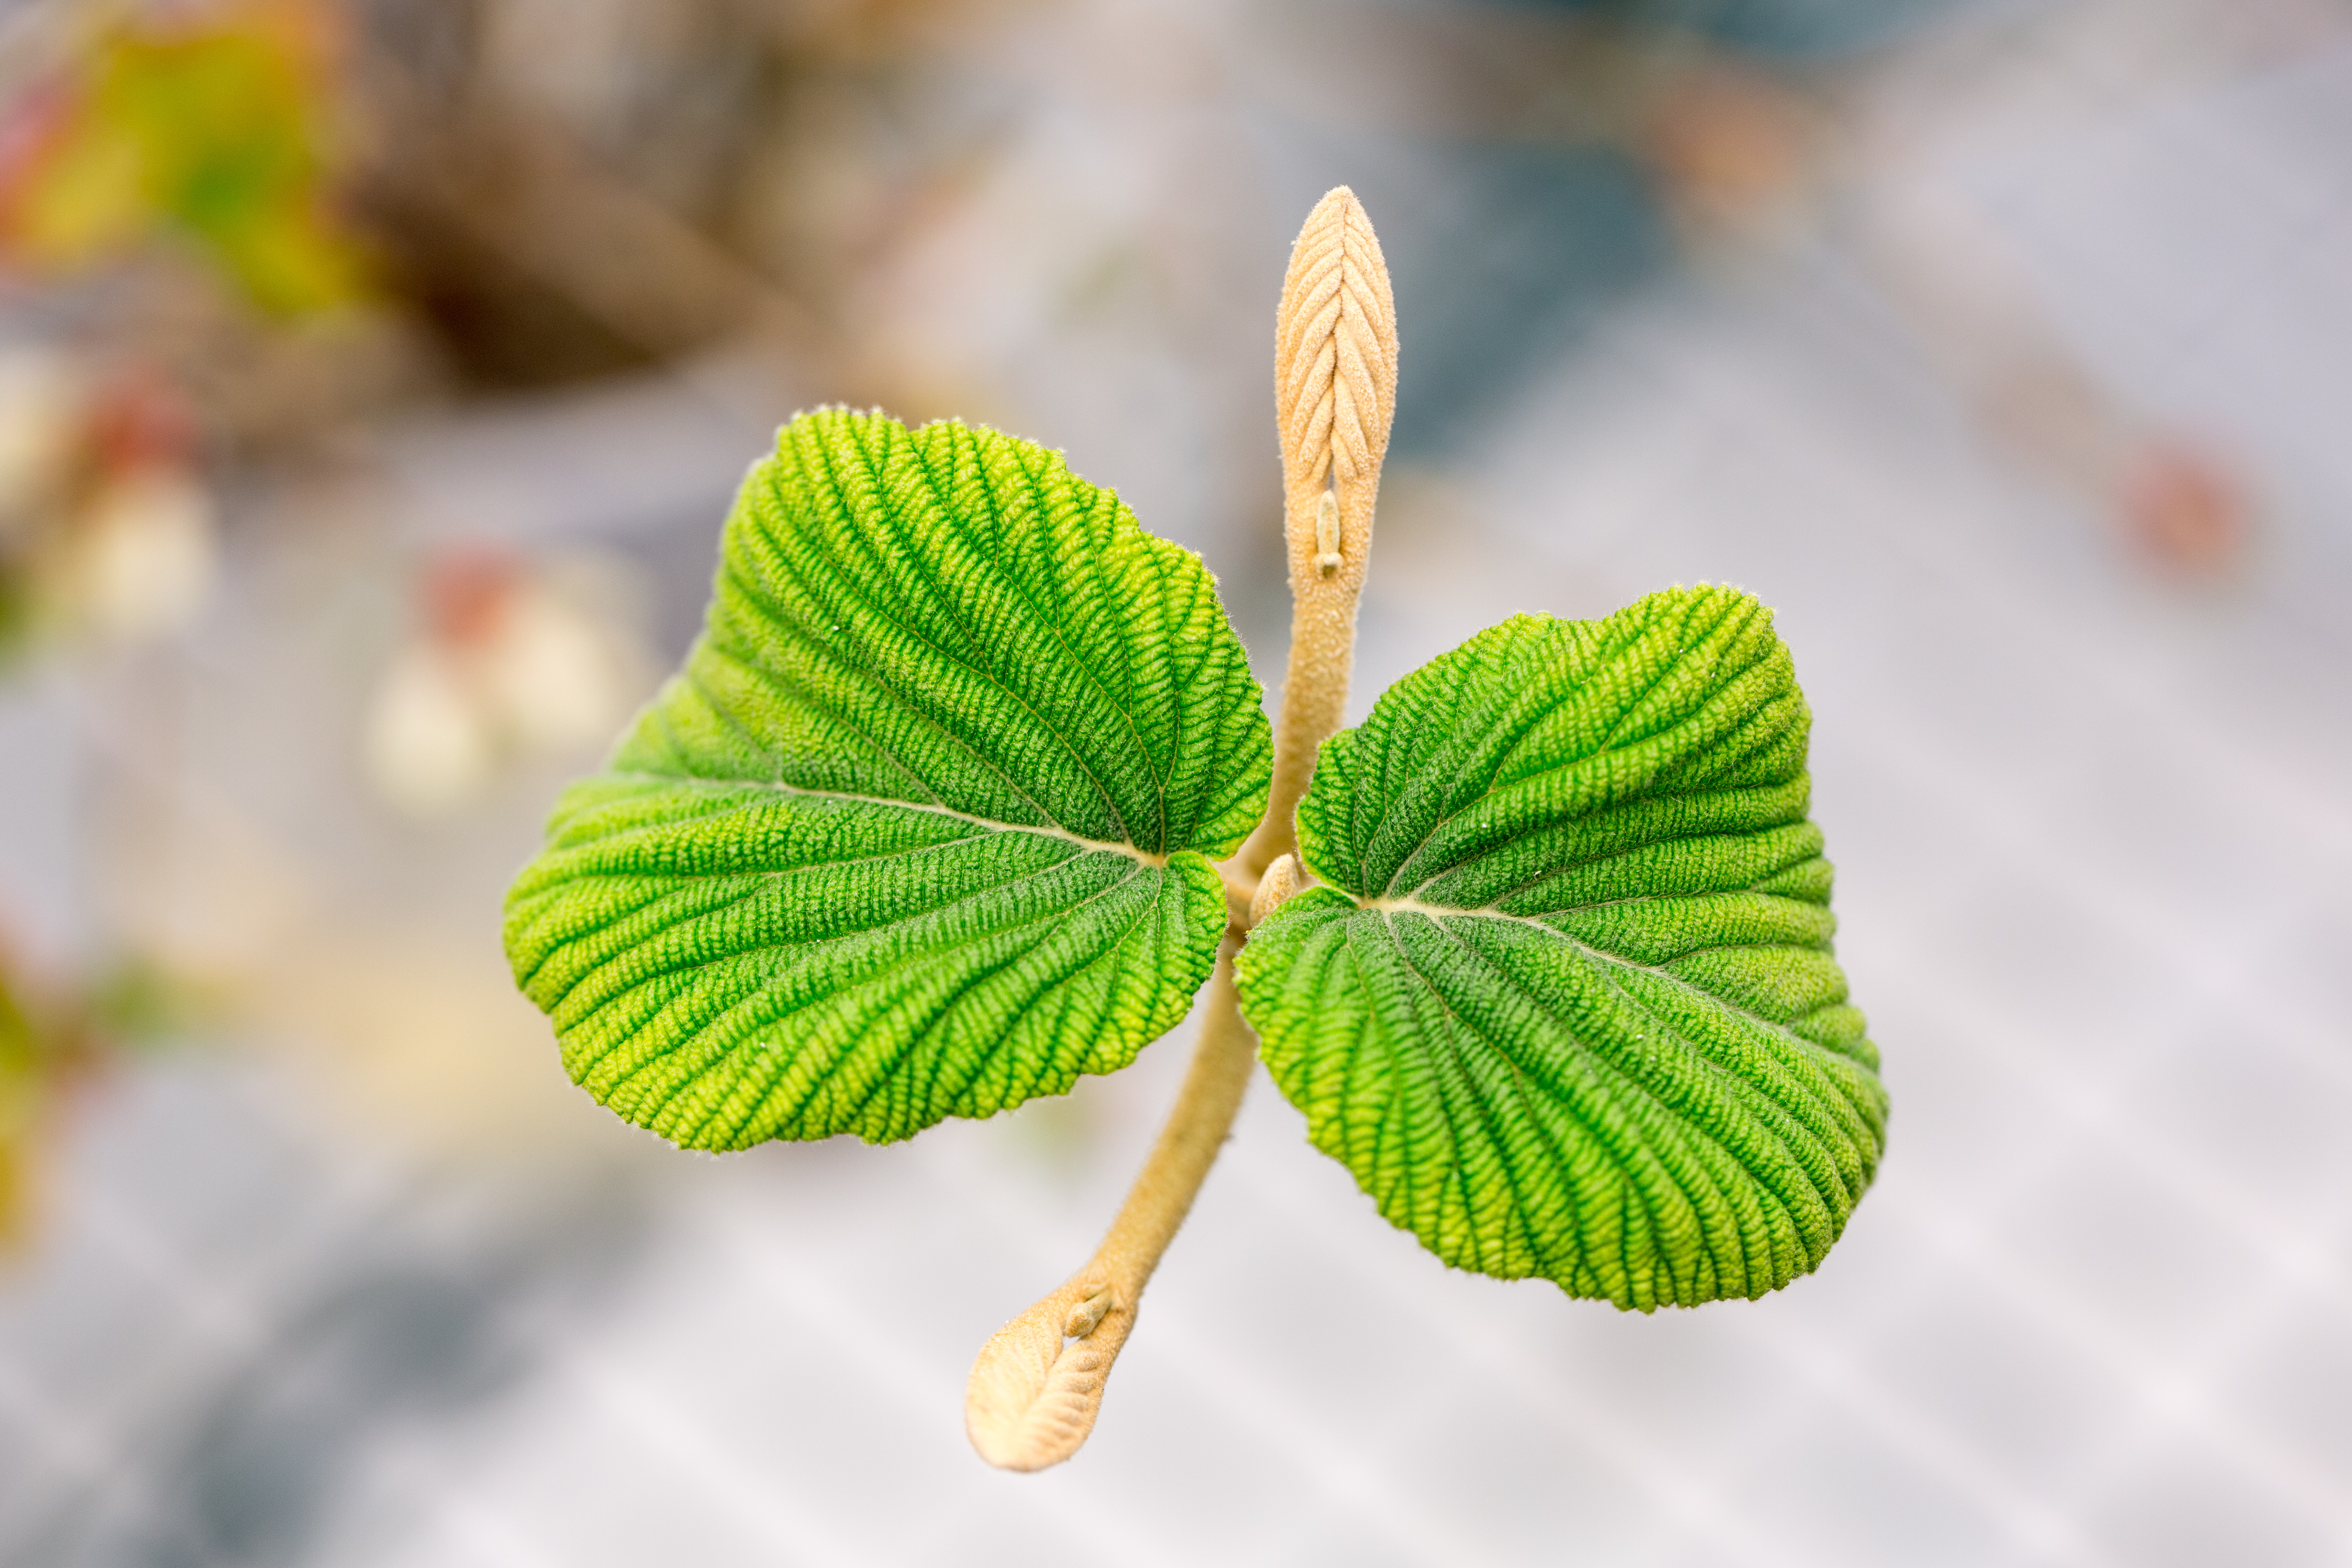
Viburnum lantanoides stage 19